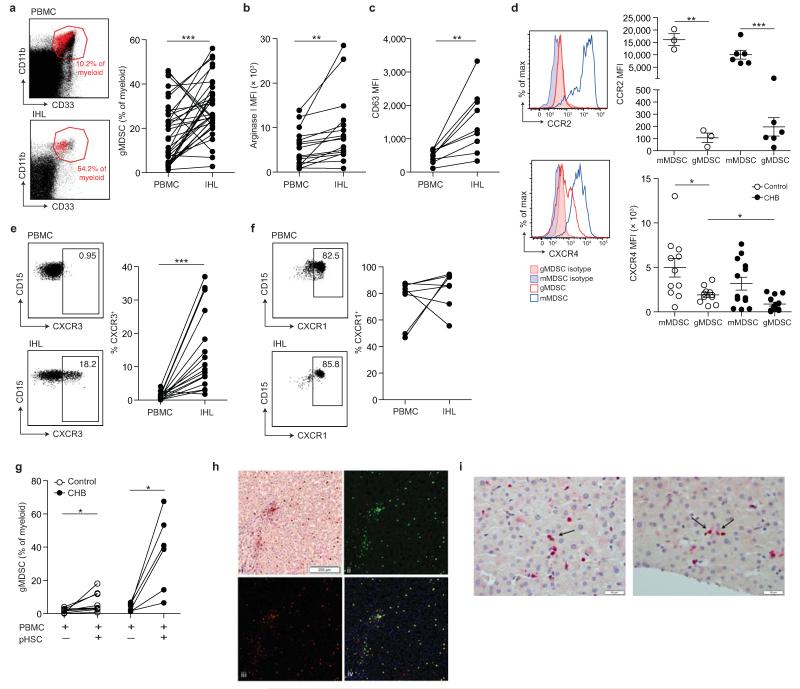
Figure 4. Accumulation of arginase+ gMDSC in the liver.
a) Representative FACS plots showing gMDSC (red) superimposed on the immature myeloid cell population from paired PBMC and intrahepatic leukocyte (IHL) samples, and the cumulative data depicting circulating compared to intrahepatic gMDSC frequencies (n=36, CHB). b) Cumulative data depicting expression (MFI) of arginase I in circulating and intrahepatic gMDSC (n=16, CHB). c) Surface CD63 expression (MFI) on peripheral and intrahepatic gMDSC (n=9, CHB). d) Representative and cumulative chemokine receptor expression on mMDSC and gMDSC of CCR2 and CXCR4. Representative and cumulative expression (%) on paired peripheral and intrahepatic gMDSC of e) CXCR3 (n=16, CHB) and f) CXCR1 (n=8, CHB). g) PBMC co-cultured with or without pHSC and analysed for gMDSC frequencies on day 6 (n=9, healthy controls, n=8, CHB). h) Representative double epitope immunostaining of liver sections from subjects with CHB for CD15 (brown, DAB) and CD66b (red, APAAP) at 100× magnification (top left); multispectral analysis (Nuance) with CD15 (green, top right) and CD66b (red, bottom left) as pseudo-fluorescent images. Co-localization of CD15 and CD66b, represented in yellow; composite image (bottom right). i) Two representative examples of double epitope immunohistochemistry with CD3 in red (APAAP) and CD66b in brown (DAB) at 400× magnification: arrows indicate CD3+ and CD66b+ cells in close association. Error bars represent the mean ± SEM for the cohorts indicated; * p<0.05; ** p<0.01; *** p<0.001; a-c, e-g paired t test; d unpaired t test.

