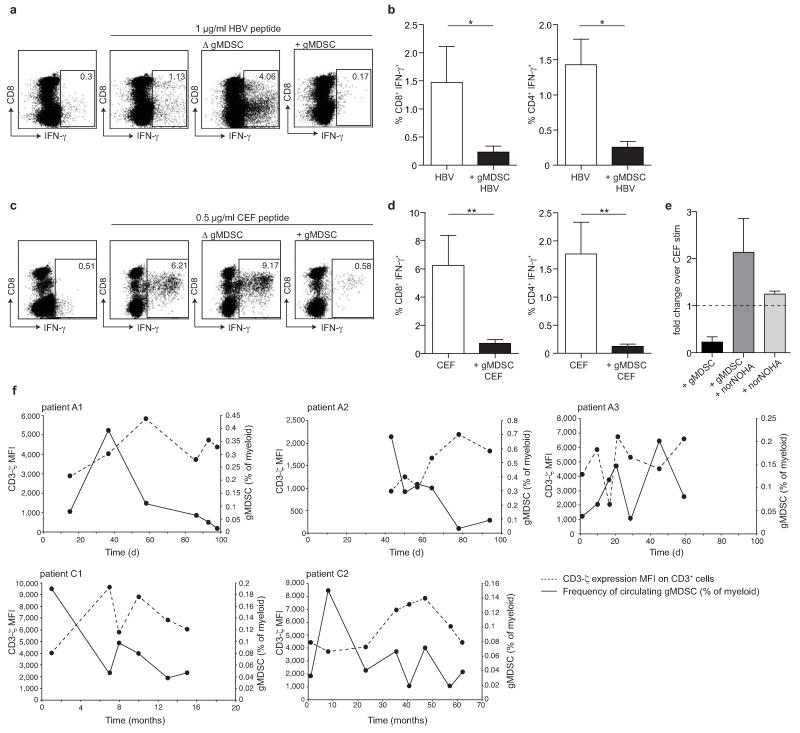
Figure 5. gMDSC suppress functional T cells in an arginase-1 dependent manner.
gMDSC were enriched or depleted using sequential magnetic bead isolation (CD14−CD15+) from PBMC for direct co-culture with autologous PBMC. gMDSC–enriched (+ gMDSC), depleted (Δ gMDSC), or undepleted PBMC were cultured with 20 IU/ml recombinant IL-2 for 5 days and stimulated to test T cell responses by intracellular cytokine production following peptide stimulation. a) Representative FACS plots showing the IFN-γ T cell response with or without stimulation with 1 μg/ml overlapping peptides spanning the core region of HBV genotype D, after gMDSC depletion or enrichment at day 0. b) Cumulative data depicting HBV-specific CD8+ and CD4+ T cell responses (subtraction of background in the absence of stimulation) in PBMC ± gMDSC (n=7, CHB). c) Representative FACS plots and d) cumulative data for IFN-γ+ CD8+ and CD4+ T cell responses to 0.5 μg/ml CEF-specific peptide stimulation (minus background as before) in PBMC ± gMDSC (n=18, CHB). Error bars represent the mean ± SEM for the cohorts indicated; * p<0.05, ** p<0.01; b, d paired t test. e) Fold change CD8+ IFN-γ− response to CEF peptide in PBMC or gMDSC enriched cultures in the presence or absence of arginase I specific inhibitor nor-NOHA (n=3, CHB). Dotted line indicates response of CD8+ T cells without gMDSC enrichment or nor-NOHA. f) MFI of CD3-ζ on CD3ε+ T cells (dashed line) in relation to circulating gMDSC frequencies as a percentage of myeloid cells (solid line) at multiple time points throughout acute HBV infection (n=3, upper panel) and spontaneous hepatic flares of HBeAg− CHB (n=2, lower panel).

