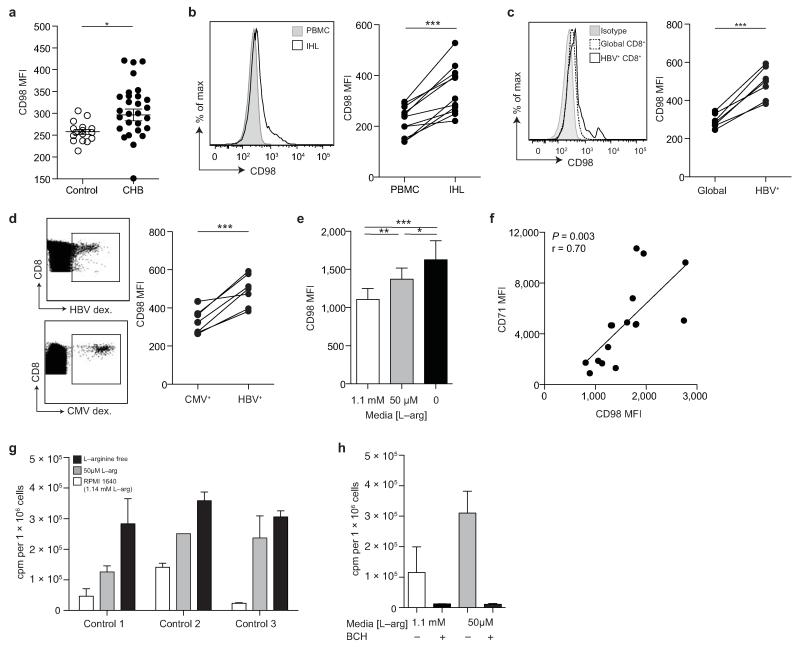
Figure 6. Differential CD98 expression on T cells in CHB.
a) Cumulative data depicting expression (MFI) of CD98 on CD3+ T cells (n=15, healthy controls; n=27, CHB). b) Representative histogram showing CD98 MFI on peripheral CD3+ (PBMC) and intrahepatic CD3+ (IHL) from a subject with CHB, and the cumulative paired data (n=11, CHB). c) Representative histogram showing CD98 MFI on global and HBV-specific CD8+ T cells (identified by ex vivo staining with a panel of HLA-A2/HBV peptide dextramers) and the cumulative data (n=7, CHB). d) Representative example of identification of paired HBV– and CMV-specific CD8+ T cells using the relevant HLA-A2 dextramers and comparison of their CD98 MFI ex vivo (n=7, CHB). e) Cumulative data showing CD98 MFI on CD3+ T cells post TCR stimulation (anti-CD3, anti-CD28) for 3 days in cRPMI with a further 24 hr in the presence of 1.14 mM L-arginine (concentration in RPMI1640), 50 μM L-arginine, or in the absence of L-arginine (L-arginine free) (n=20, healthy controls). f) Co-expression of CD71 and CD98 on CD3+ T cells in the absence of L-arginine for 24 hr post TCR stimulation (n=15, healthy controls). g) Uptake of radiolabelled amino acid (phenylalanine) in T cells post TCR stimulation, before culture varying concentrations of L-arginine for 24 hr. h) Radiolabelled phenylalanine uptake in the presence or absence of the system-L inhibitor BCH (10 mM) ± L-arginine deprivation (n=3, healthy controls). Error bars represent the mean ± SEM for the cohorts indicated; * p<0.05; ** p<0.01; *** p<0.001; a, e unpaired t test, b-d paired t test, f Pearson product-moment correlation coefficient.

