
Fig. 3.
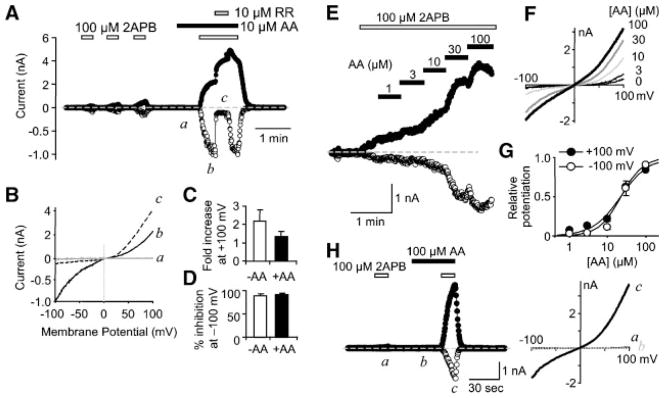
Properties of AA-potentiated TRPV3 currents. A–D, effects of 10 μM ruthenium red (RR) on the currents evoked by AA and 2APB in TRPV3-transfected cells. Shown are representative traces for membrane currents (A) at +100 (filled circles) and −100 mV (open circles) and I–V curves (B) during the application of AA (a), AA +2APB (b), and AA +2APB +RR (c). Dashed line (A) indicates zero current. Different scales are used to enlarge the current at negative potentials. (C, D) Summaries of fold increase at +100 mV (C) and % inhibition at −100 mV (D) induced by 10 μM RR for TRPV3 currents evoked by 2APB alone (open bars, n = 6) or 2APB +AA (filled bars, n = 8). E–G: Dose-dependence of AA-induced potentiation of 2APB-evoked TRPV3 currents. E: Membrane currents at +100 and −100 mV during continued application of 2APB and AA was added with increasing concentrations as indicated. F: I–V curves obtained at AA concentrations as indicated (in μM). G: Dose-response curves obtained after subtraction of the initial response to 2APB alone. Shown are normalized responses at +100 (filled circles) and −100 mV (open circles) from four cells. Curves are fits to the Hill equation. H: Membrane currents before and during preincubation with 100 μM AA for 30 sec and subsequent addition of 2APB in a TRPV3-transfected cell. I–V curves are shown to the right for time points as indicated. Similar results were obtained from two more cells. BAPTA was 10 mM in the pipette solution for all experiments.