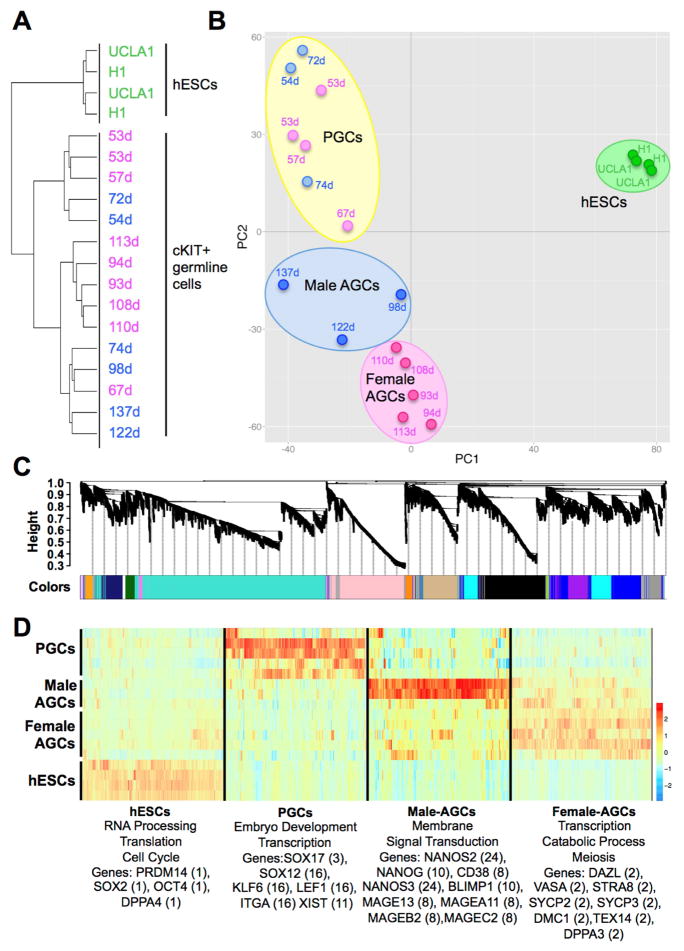
Figure 1. Human germ cells are distinct from hESCs.
(A) Unsupervised hierarchical clustering of hESCs and cKIT expressing germline cells isolated from human prenatal testes (blue) or ovaries (pink). Day (d) of prenatal development post fertilization is shown. (B) Principal component analysis. Each dot represents a sample. Blue = male, pink = female germline cells, green = hESCs. Germline samples separate into three clusters in PC2 including primordial germ cells (PGCs) and Advanced Germline Cells (AGCs), which are either male or female. (C) Weighted gene co-expression network analysis of hESC, PGC and AGC samples showing a hierarchical cluster tree of co-expression modules. Each module corresponds to a branch labeled by a distinct color shown underneath. (D) Heatmap showing relative expression of 6,583 genes in 4 representative modules across all samples. For each developmental window only the most highly correlated modules are shown with assigned biological names: hESCs (module 1), PGCs (module 16), Male AGCs (module 24) and Female AGCs (module 2). Representative gene ontology terms enriched in the highest correlated module are shown below, as well as representative hESC and germ cell-related genes found in the statistically significant modules for that group. The specific module is shown in parenthesis. See also Figure S1.

