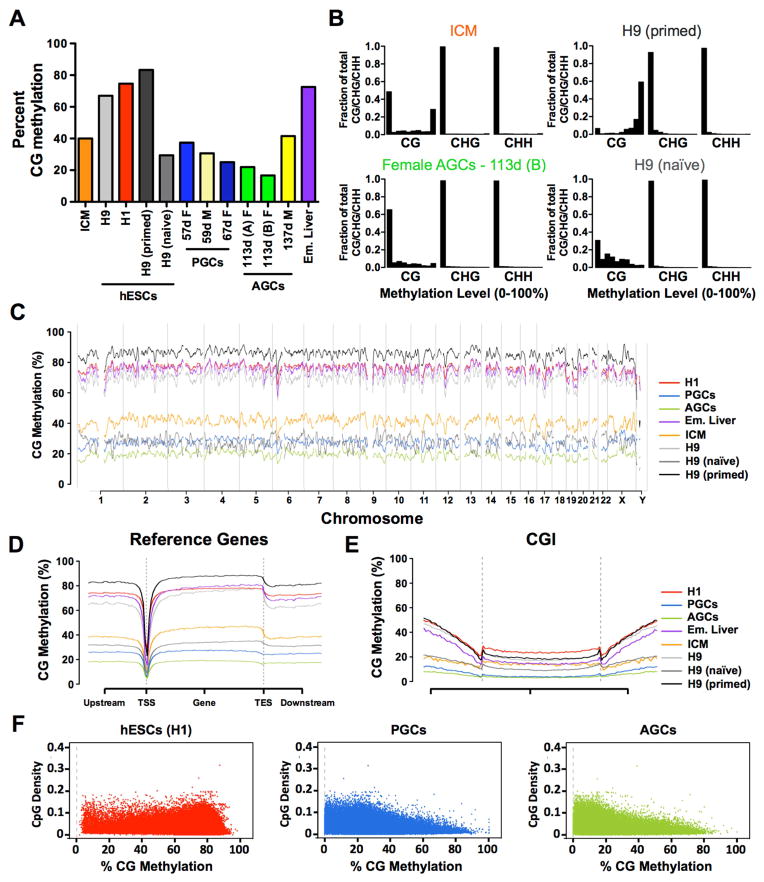
Figure 2. Female AGCs represent the most demethylated genomic state.
(A) Average CpG methylation in human inner cell mass (ICM), hESCs, PGCs, AGCs and embryonic liver (Em. Liver). Age of male (M) and female (F) germline samples in days (d) postfertilization is shown. (B) Distribution of cytosine methylation in ICM and AGCs, H9 primed and H9 naïve hESCs. The x axis represents methylation levels binned in ten increments of 10% (ie 0–10%, 10–20% etc). y axis is fraction of total CG/CHG/CHH. (C) Average genome wide levels of CpG methylation across all chromosomes in 1Mb windows. PGCs = merged reads from 57- and 67-day germline cells, and AGCs = merged reads from 113-day germline cells, H9 primed and H9 naive = merged reads from 3 biological replicates. (D) Metaplot of CpG methylation at reference genes. TSS, transcription start site; TES, transcription end site. (E) Metaplot of CpG methylation at CpG Islands (CGI). (F) Correlation between CpG density and methylation for H1 hESCs; PGCs (merged) AGCs (merged). PGCs (Primordial Germ Cells), AGCs (Advanced Germ Cells), Em. (Embryonic), ICM (Inner Cell Mass). See also Figure S2.

