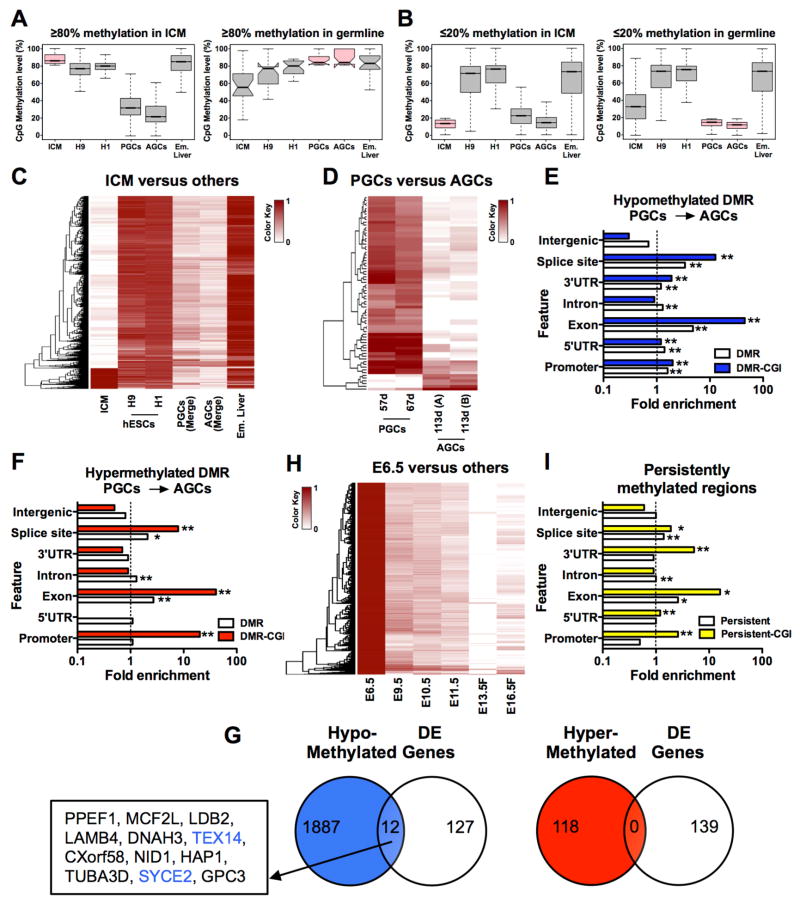
Figure 3. Methylation reprogramming in vivo is dynamic in human and mouse.
(A) Box plots showing fate of highly methylated CpGs (≥80% CpG methylation) in ICM (left panel) and germline cells (right panel). For ICM n = 8,850 hypermethylated windows of 5kb were identified. For PGC and AGC we identified n=21 hypermethylated 5kb windows. (B) Box plots showing hypomethylated windows (<20% CpG methylation) in ICM (left panel) and germline cells (right panel). For ICM n= 64,787 windows and for germline cells n=95,479 5kb-windows were identified. (C) Heatmaps showing methylation variable regions in 5kb windows with >80% methylation difference in ICM (n=9,072, FDR = 2.28%) relative to other samples. (D) Heat map of differentially methylated regions between PGCs and AGCs using 200bp windows (n= 1,049,420) with 3,456 regions (FDR <0.001%) identified (0.33% of the total number of windows). (E) Enrichment analysis of hypomethylated DMRs and (F) hypermethylated DMRs at indicated genomic features. Enrichment is accepted if fold enrichment is ≥1.0. DMRs and CGI-containing DMRs (DMR-CGI) are shown. * p <0.05, ** p<0.01. (G) Correlation of hypo- (left panel) and hyper-methylated (right panel) DMRs with differentially expressed (DE) genes reveals limited to no overlap. (H) Heatmaps showing methylation variable regions in 5kb windows with >80% methylation difference in E6.5 mouse epiblast (n = 499,541, FDR = 0.1 %). Female (F). (I) Identification of genomic features with persistent methylation (≥50% CpG methylation in 200 bp windows with >6 CpG sites per window). n= 67,817 windows meeting this criteria were in common between data sets resulting in the identification of n=1,471 persistently methylated windows (2.17%). For (C,D,H) Darker color indicates higher CpG methylation, white indicates absence of CpG methylation. FDR, false discovery rate estimated from simulated methylomes (see Methods). See also Figure S3.

