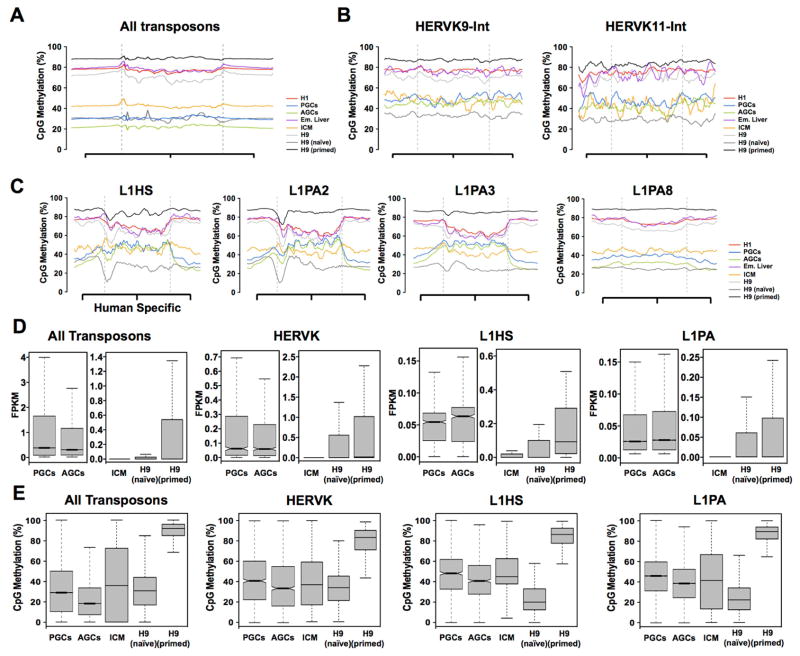
Figure 4. Demethylation of transposable elements in naïve hESCs in vitro is less retained than germline cells and ICM.
(A) Metaplot of all transposons irrespective of type exhibit DNA demethylation similar to the genome average. (B) Metaplots of CpG methylation across HERVK9-int and HERK11-int retrotransposons, showing that contrary to the average for the HERVK class, CpG methylation in PGCs and AGCs are comparable to ICM with H9 naïve cells exhibiting the lowest levels of CpG methylation. (C) Metaplots of CpG methylation for L1HS, L1PA2, L1P3 and L1PA8. Naïve hESCs exhibit the lowest levels of CpG methylation at this subfamily (area within the dashed grey line). This is particularly dramatic at the younger elements such as the Homo sapiens specific L1HS and the closely related L1PA2. (D) Box plots showing average RNA expression of transposons in PGCs, AGCs, ICM, H9 naïve and H9 primed hESCs as indicated. Average transposon expression is less than 1.0 FPKM. (E) Box plots showing CpG methylation of all transposons, HERVK, L1HS and L1PA elements in PGCs, AGCs, ICM, H9 naïve and H9 primed hESCs. See also Figure S4.

