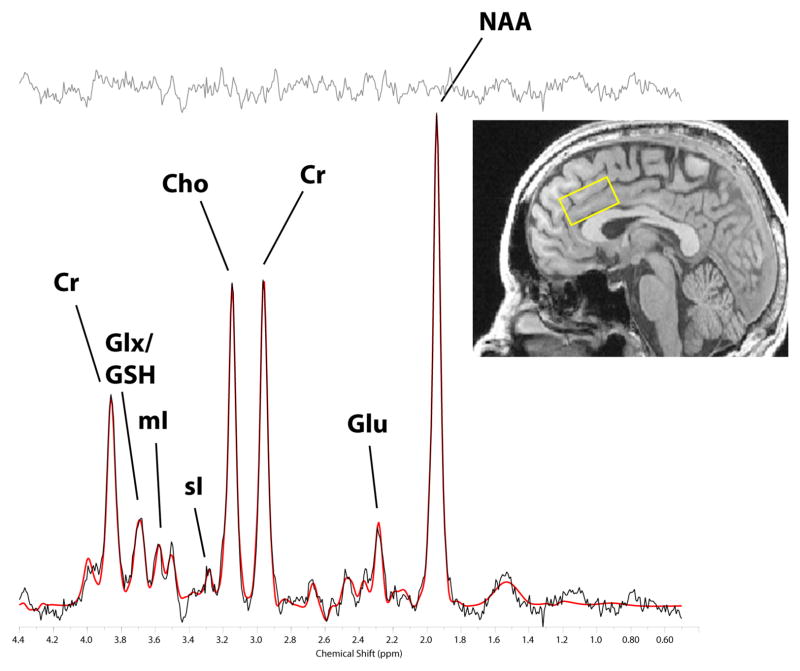
Figure 1.
LCModel spectrum fit of a dorsal anterior cingulate cortex J = 0.0 Hz spectrum. The voxel position (inset, yellow box), the source spectrum (black trace), the LCModel-fitted spectrum (red trace), and the residual (gray trace at top of figure) are shown. Individual metabolite peaks are labeled (Cr: total creatine; Glx: glutamate + glutamine; GSH: glutathione; mI: myo-inositol; sI: scyllo-inositol; Cho: choline-containing metabolites; Glu: glutamate; NAA: N-acetylaspartate).

