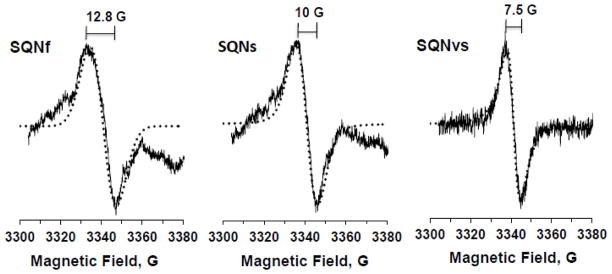
Fig. 4.

Three distinct SQ species in the wild-type complex I resolved by power saturation and simulation analyses. The SQNf spectrum was obtained by subtracting 35% of SQNs and 15% of SQNvs from the control EPR data (reduced with NADH in the presence of DQ) at 20 mW. The SQNs spectrum was obtained by subtracting 70% of SQNvs from the EPR data reduced with NADH in the presence of DQ and gramicidin D at 3 mW. The SQNvs spectrum was obtained from the EPR data reduced with NADH in the presence of DQ and squamotacin at 0.08 mW. The EPR conditions were the same as described in Fig. 2 except the data were accumulated 10 times. Simulated spectra are shown as dotted lines. The g-tensor principal values are: SQNf, gx = 2.0046, gy = 2.0067, and gz = 2.0067; SQNs, gx = 2.0049, gy = 2.0065, and gz = 2.0065; SQNvs, gx = 2.0051, gy = 2.0061, and gz = 2.0061. The ratios of Gaussian to Lorentzian broadenings are 1 to 0, 3 to 1, and 0 to 1 for SQNf, SQNs, and SQNvs, respectively. The linewidths are shown in gauss.
