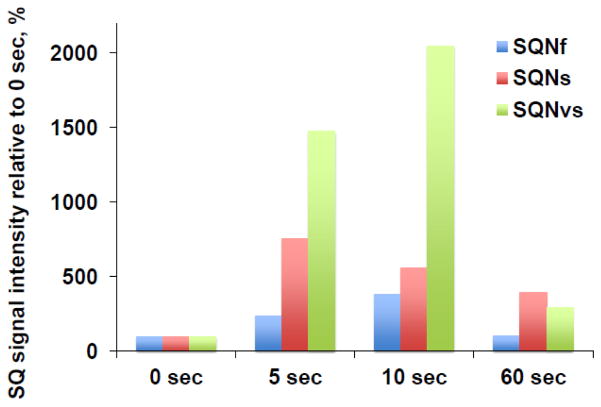
Fig. 5.
Time course of the SQNf, SQNs, and SQNvs signals after the addition of NADH in the wild-type complex I reconstituted in proteoliposomes. The signal amplitude at 0 sec was determined from the EPR data for the sample in which only DQ was added (no NADH). Since the optimal microwave power to obtain the highest amplitude of each SQ species depends on microwave powers, the EPR data measured at 51 mW, 2 mW, and 0.2 mW were chosen to monitor the rise and decay time course of the SQNf, SQNS, and SQNvs signals, respectively. The total SQ signal intensity at 0 time was: 0.1197 at 51 mW; 0.0596 at 2 mW; 0.0452 at 0.2 mW. The changes in the intensity of each SQ signal are shown as % of the intensity at 0 time. [WT-PL] = 1.8 mg/ml, NADH:DQ = 7.96 μmol/min/mg and NADH:Ferricyanide = 78 μmol/min/mg. We measured three different sets of samples at 0 and 10 sec, two sets of samples at 0, 5, 10 sec, and two sets of samples at 0, 5, 10, and 60 sec.

