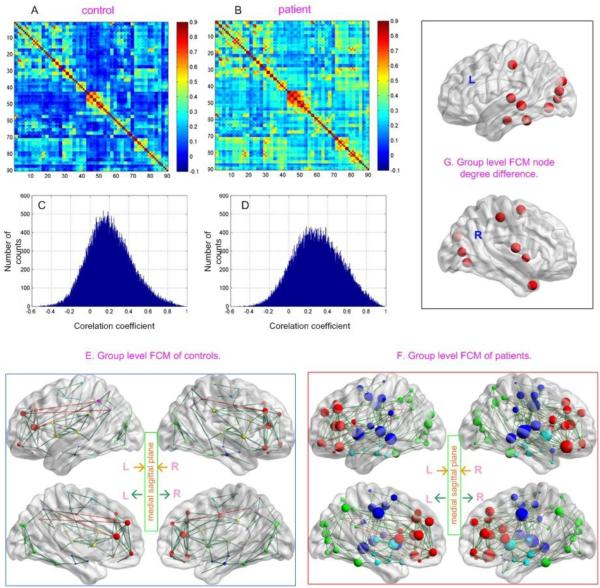
Fig 1.
Resting FCM of DRUG patients and the age-matched controls (CTL). A) and B) The average inter-regional correlation coefficient (CC) matrix of CTL, and DRUG, respectively; C) and D) The histogram of the CC matrices shown in A and B, respectively; E) and F) The average FCM of CTL and DRUG, respectively; G) Network nodes with significantly higher degree in DRUG patients than in CTL (defined by p<0.05, bonferroni corrected for 90 comparisons). Network nodes are projected into the brain surface based on their spatial locations. As indicated by the inset in the middle of E and F, the top two sagittal slices of E and F are the pictures projected to the left (L) and right (R) brain hemisphere, respectively; the left and right sagittal slices on the bottom row are the projections of the left and right hemisphere to the middle sagittal plane, respectively. Node color in E and F indicates different modules (cliques). Red lines and dark green lines represent long (>=75 mm) and short (<75 mm) distance connections, respectively. Node size was in proportional to the node degree or node degree difference (in G).

