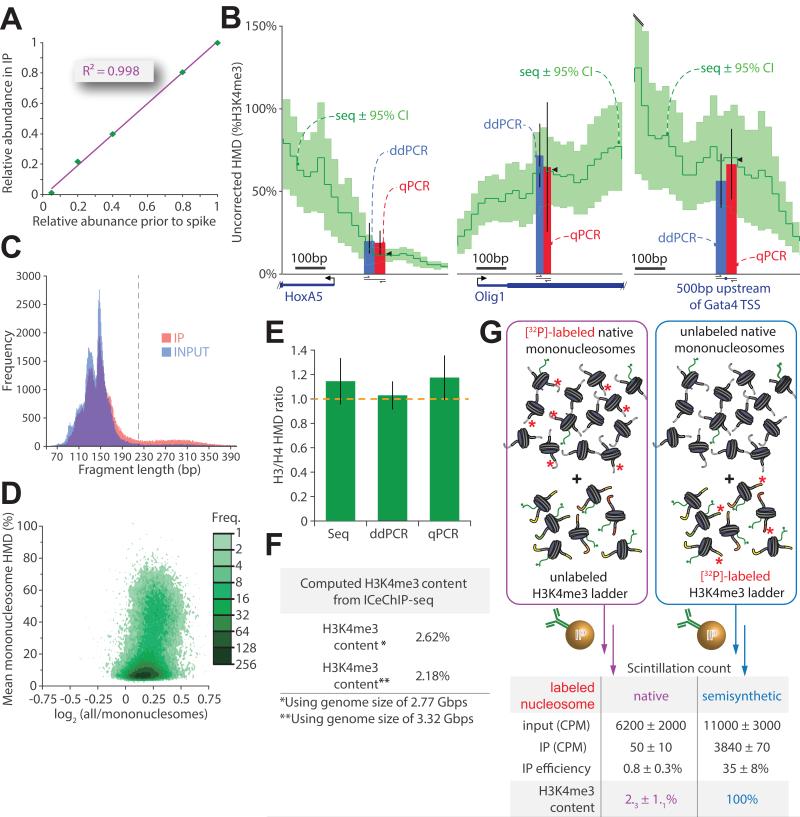
Figure 4. A critical examination of ICeChIP: precision and accuracy.
(A) The relative abundance for each barcode in the H3K4me3-directed IP is plotted against it’s abundance in the input (measured by densitometry in triplicate prior to nucleosome reconstitution and spiking). (B) ICeChIP-seq compared to ddPCR and qPCR in mESCs: uncorrected H3K4me3 Histone Modification Density (HMD, dark green; 95% confidence interval, light green) contoured over 25 bp intervals. Blue and red bars represent HMD (%H3K4me3) measured by ddPCR and qPCR, respectively, positioned over the indicated amplicon; black wedges are mean seq HMD over the amplicon. (C) Histogram of chromatin fragment length distributions for mESC input and IP for 105 randomly selected paired-end reads each dataset; upper bound chosen for mononucleosome filter indicated in grey dashed line. (D) Avidity bias measured by HMD averaged over peaks called with MACS (p<10−20) on mESC dataset filtered for mononucleosomes expressed as a function of the log2 of ratio of HMD signal averaged over peaks for all nucleosomes over HMD signal averaged over peaks for mononucleosomes only. (E) The accuracy of ICeChIP-seq assessed by comparison of H3 to H4 HMD measurement techniques by measuring the ratio of histone H3 to histone H4 densities at three discrete loci. (F) Global H3K4me3 abundance in HEK293 cells calculated by averaging the ICeChIP-derived HMD over the assembled and theoretical genome sizes. (G) Total H3K4me3 content for the HEK293 measured by the recovery of radioactive genomic DNA post-H3K4me3 IP, corrected with the IP efficiency measured in parallel experiments with radiolabeled semisynthetic nucleosomes in the presence of unlabeled native chromatin (both performed in triplicate). All error bars are 95%CI. See also Figure S4.

