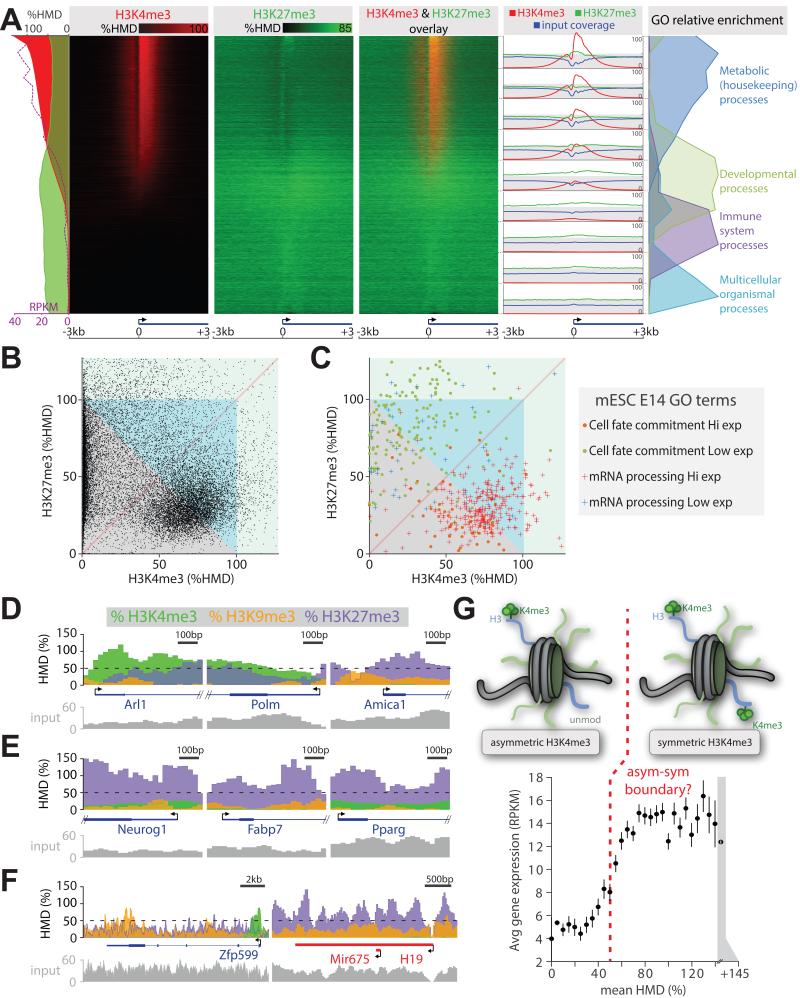
Figure 7. Comparison of histone modification amounts measured with locus precision.
(A) Heatmap presentation of H3K4me3 and H3K27me3 amounts measured by ICeChIP from mESCs at all coding TSSs, sorted by decreasing H3K4me3 modification density; average HMDs and expression level from (Xiao et al., 2012), or input coverage is plotted along the left edge; relative GO term enrichment or average HMD and input coverage for the 9 indicated blocks is depicted on the right. (B) Scatter plot of H3K4me3 versus H3K27me3 HMD for the first 400bp of all mESC genes. (C) HMDs as in panel B, displayed for cell fate determination or mRNA processing genes grouped into high expression (RPKM > 5) and low expression categories (RPKM ≤ 5). Zoomed views of selected loci associated with: (D) metabolic/housekeeping (Arl1, Polm), immunity (Amica1); (E) developmental genes; and (F) zinc finger (Zfp599) and imprinted (H19) genes. (G) Binned average gene expression (RPKM) ± SEM as the function of binned mean H3K4me3 HMD averaged over TSS ± 200bp. See also Figure S7.

