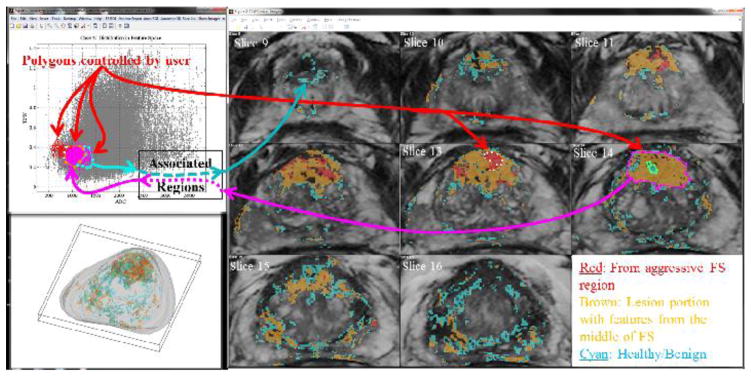
Figure 3.

The InFS–Explorer© GUI workspace for a 62 year old patient with PCa. On both MR–FS (top left) and anatomic images (right), ROIs are drawn interactively showing associated pixels and feature points respectively. Initially, by demarcating the features of the red ROI on Slice 13, the anatomic burden is visualized in red in the anatomic volume. The features of the smaller adjacent green ROI on Slice 14 were covered when the purple ROI was placed on the larger lesion. In turn, when brown and cyan FS ROIs were drawn respectively around the purple and green feature points, PCa’s heterogeneous appearance can be visualized on the anatomical images as well as on the 3 D representation of the gland (bottom, left).
