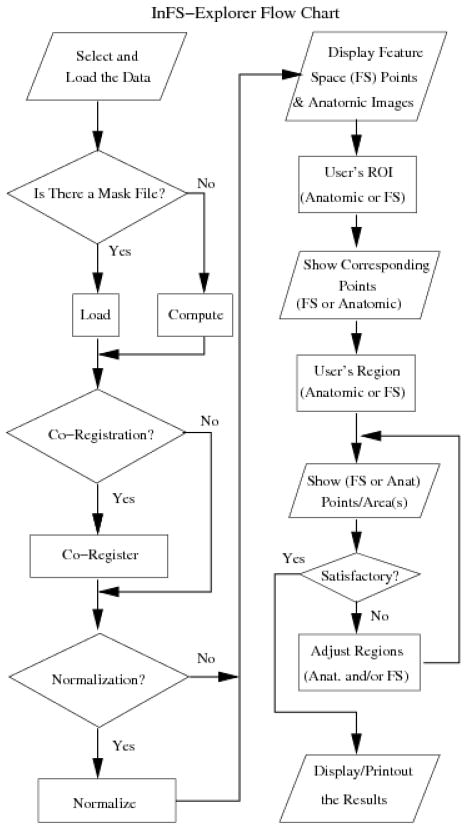
Figure 4.
The flow chart describing the operation of InFS–Explorer©. The study preparation steps, where data location and subroutine selections are provided as forms and check boxes, are on the left–hand side. Upon completion, InFS–Explorer© loads and processes the data to present the GUI of Fig. 3. Subsequently, FS analysis is conducted using the steps on the right–hand side.

