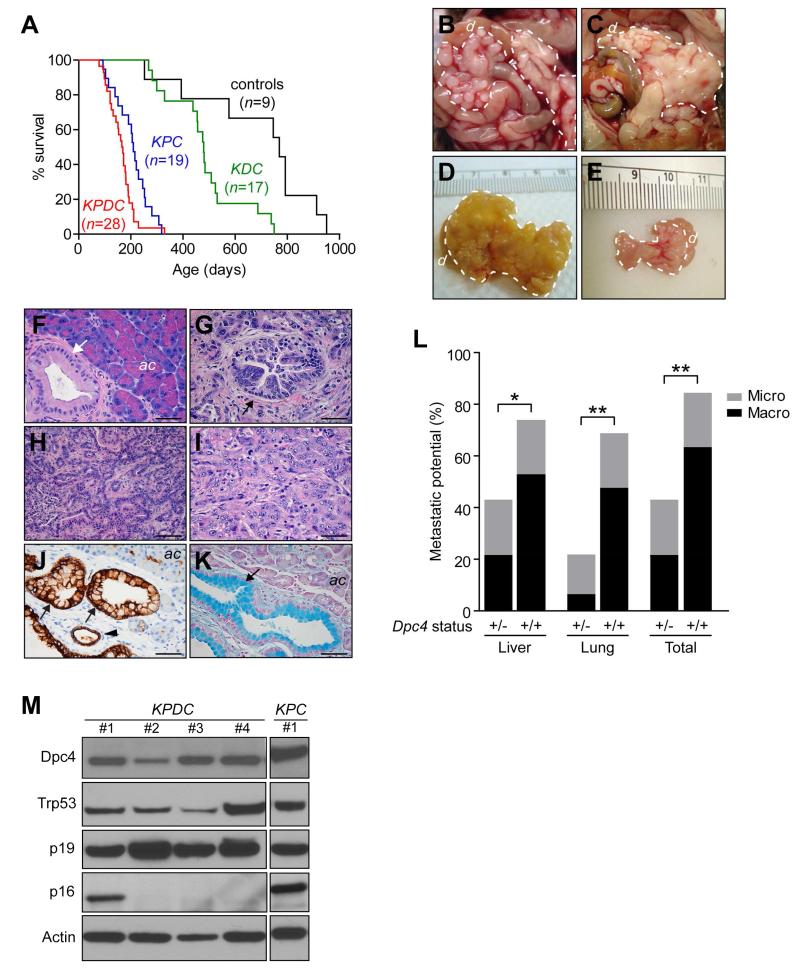
Figure 1. Molecular characterization of tumor progression in KPDC mice.
(A) Kaplan-Meier survival of KPDC animals (167 days) was significantly less than control animals (769 days, p<0.001), KrasLSL-G12D/+;Dpc4flox/+;p48Cre/+ (KDC) mice (479 days, p<0.001) and KPC mice (209 days, p<0.05) (log rank test for each pairwise combination).
(B and C) Gross pathology of KPDC pancreata at necropsy. Dashed lines, tumor.
(D) Representative KPDC tumor.
(E) Representative KPC tumor.
(F) Pancreas histology in young KPDC animal (age = 109 days). Arrow, PanIN-1A.
(G) Pancreas histology in older KPDC animal (age = 165 days). Arrow, PanIN-3.
(H) Moderately well-differentiated KPDC PDA.
(I) Poorly differentiated KPDC PDA.
(J) CK-19 immunoreactivity highlights KPDC ductal epithelium. Arrows, PanIN-1A; arrowhead, normal duct.
(K) Alcian blue histochemistry (arrow) reveals mucin content in preinvasive KPDC lesion.
(L) Metastatic potential (% with metastases) in KPDC (+/−) and KPC (+/+) animals (*p<0.05, **p<0.01). (+/+) and (+/−) indicate WT and heterozygous deleted Dpc4, respectively.
(M) Immunoblots of representative KPDC and KPC primary PDA cell lysates from independent animals.
d, duodenum; ac, acinar cells. Scale bars, 50 μm. See also Table S1 and Figure S1.

