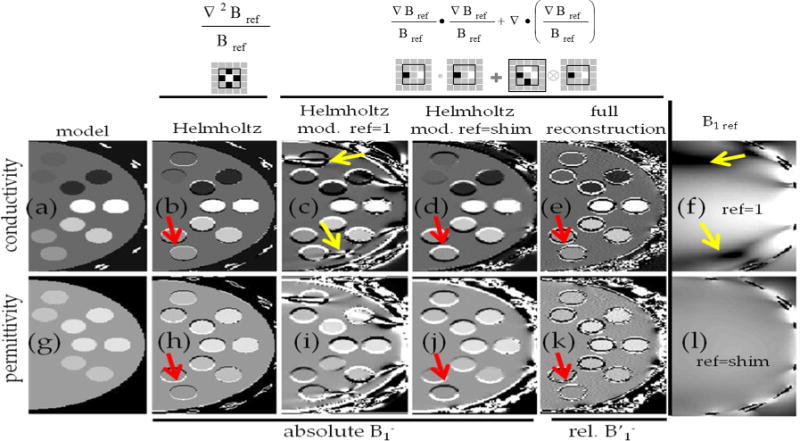
FIG. 2.

Comparisons of various methods for electrical property mapping in simulations. Conductivity and permittivity maps of a transverse slice across the numerical phantom are shown in the top and bottom rows, respectively. The columns show (a,g) – true property maps using model parameters; (b,h) – maps reconstructed when using Eq. [1] assuming complex of all coils is fully known; (c,i) and (d,j) maps reconstructed using modified Helmholtz equation (Eq. [4]) using either one single coil sensitivity distribution (f) or using a locally phase matched coil combination (l) assuming complex of all coils is fully known; (e,k) reconstructed maps using the proposed Single Acquisition Electrical Property mapping method, starting from relative receive coil sensitivities and using as the reference the main mode (represented by the top-ranked singular vector) in the sliding window kernel. For presentation purposes, the reference maps (f,l) are shown in logarithmic scale. Red arrows highlight the artifacts present at tissue interfaces where the conductivity or permittivity are not constant. Yellow arrows highlight the sensitivity of the modified Helmholtz Equation to numerical errors arising from a low B1ref, which can be overcome by choosing a reference mode devoid of such points in the kernel. A 2D cut through the 3D Laplacian kernel is shown under each version of the Helmholtz equation. The thin black squares in each kernel indicate the three-voxel effective spatial resolution of each method given these choices of derivative kernel. [Color figure can be viewed in the online issue, which is available at wileyonlinelibrary.com.]
