
Figure 5. Expression of the amiR_CH42 and down-regulation of CH42.
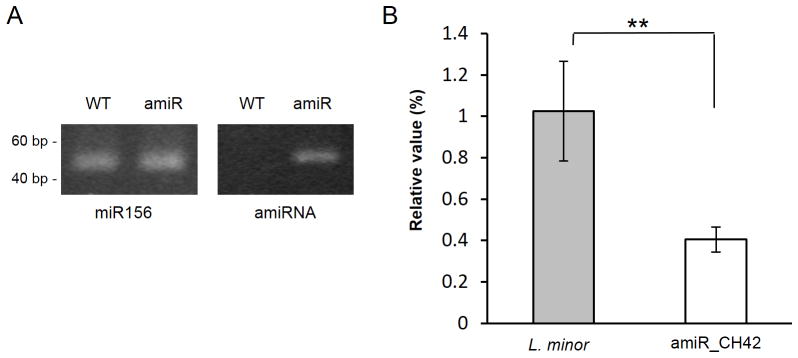
Stem-loop end-point RT-PCR amplification of miRNAs, using endogenous miRNA (miR156) as an internal control (A). Changes in relative expression levels of CH42 mRNA were measured by quantitative RT–PCR and normalized to Tubulin α mRNA (B). The s.d. values for the qRT-PCR are shown, n=9. Stars indicate statistical significance in two-tailed Student’s t-test, **P<0.002