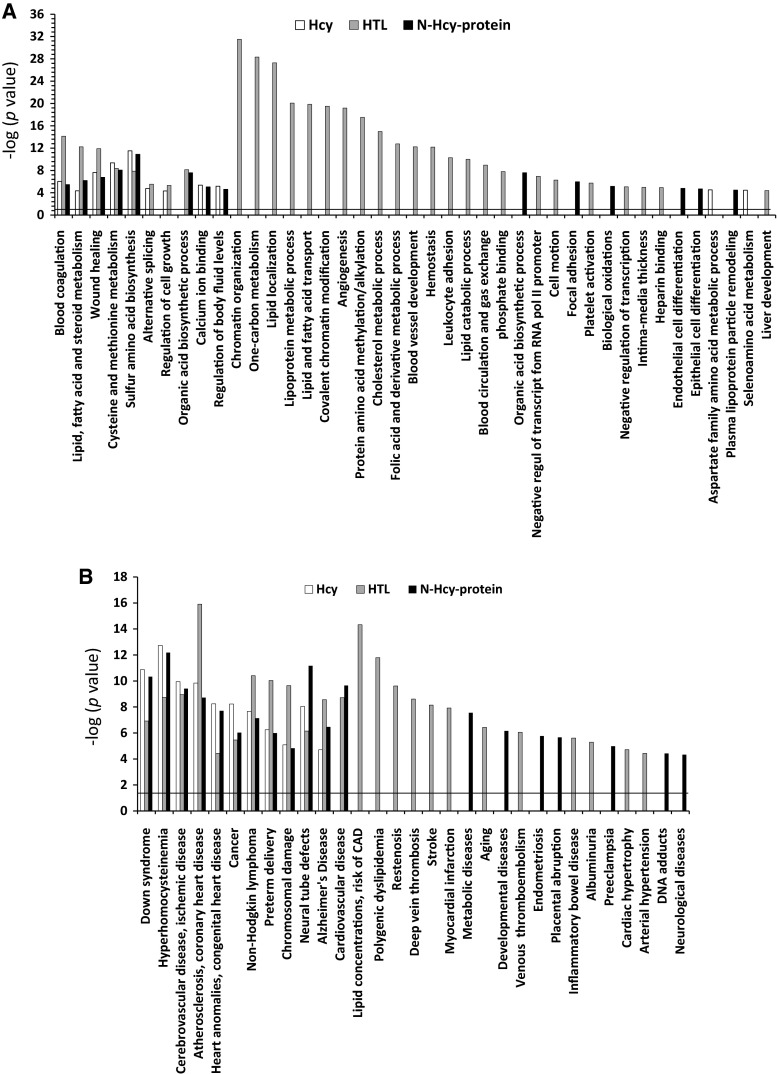
Fig. 3.
Molecular pathways and disease associated with Hcy-thiolactone, N-Hcy-protein, and Hcy identified by DAVID tool. The analysis utilized P value 0.05, and Benjamini–Hochberg, Bonferroni, and FDR corrections were applied for minimizing the number of false positives. Panel A, molecular pathways; Panel B, diseases

