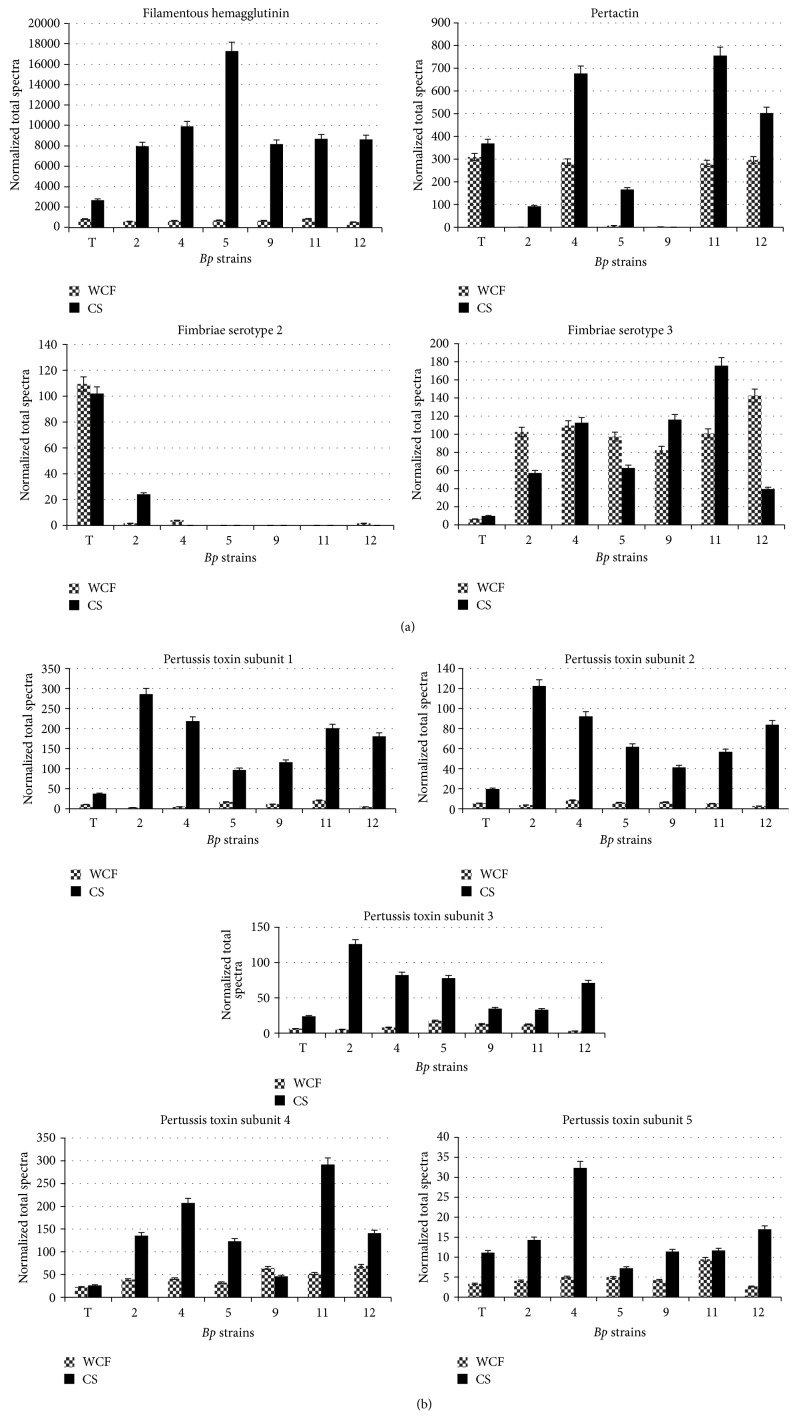
Figure 2.
Comparative relative protein abundance profiles for B. pertussis acellular vaccine components. A bar chart illustration to compare normalized total spectra values for each acellular pertussis vaccine component identified in whole cellular fractions (WCF) (diamond bar) versus culture supernatant (CS) (black bar). (a) Filamentous hemagglutinin, pertactin, and serotype fimbriae 2/and 3. (b) Pertussis toxin subunits 1 through 5.

