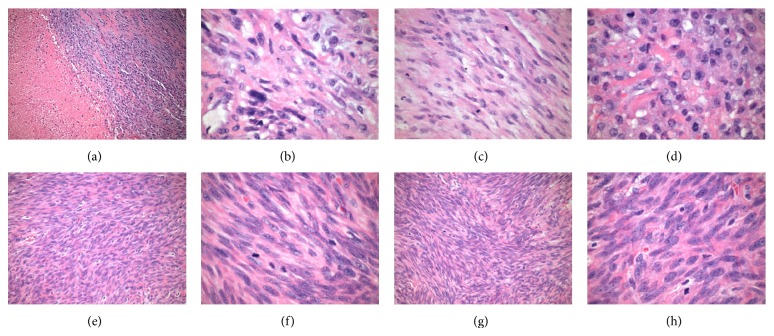
Figure 2.
Histology. ((a)–(d)) Uterus: (a) hypercellularity with geographic necrosis (100x), (b) cellular atypia (600x), and ((c) and (d)) mitotic figures (400x). ((e)-(f)) Left Ovary. Cellular atypia and mitoses ((e) 200x and (f) 600x). ((g)-(h)) Right ovary. Cellular atypia and mitoses ((g) 200x and (h) 600x).

