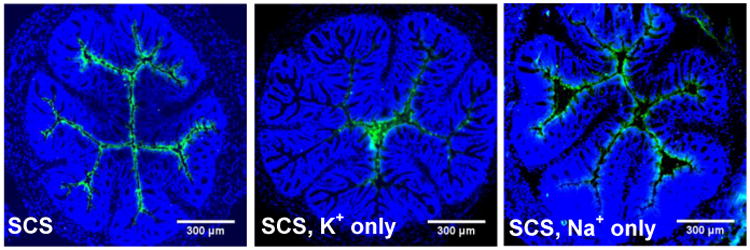
Figure 4. Distribution of TFV in SCS, SCS with only potassium concentration matched to that of feces, and SCS with only sodium concentration matched to that of feces.

Distribution in transverse colorectal cryosections 5-10 min after intrarectal administration of 1% TFV (1:10 TFV-FITC:TFV) in SCS, SCS without sodium (SCS, K+ only) and SCS without potassium (SCS, Na+ only). Cell nuclei in transverse cryosections are stained with DAPI. Images are representative of n ≥ 3 mice. White scale bars = 300 μm.
