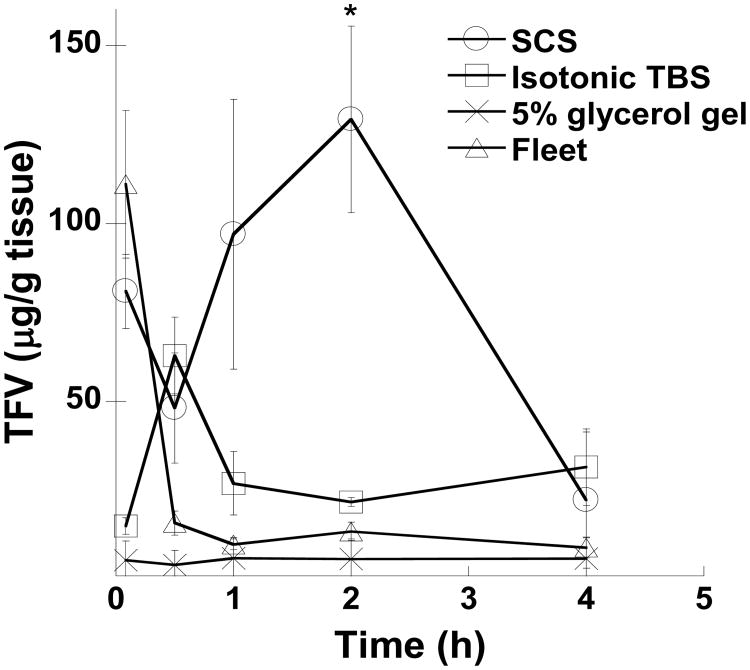
Figure 5. Pharmacokinetic analysis of TFV in mouse colorectal tissue.
The calculated amount of TFV present in mouse colorectal tissues is shown for up to 4 h after administration. 1% TFV was administered in the simulated colon solution (SCS) (150 mOsm), isotonic TBS (450 mOsm), 5% glycerol gel (760 mOsm), and Fleet® enema (2200 mOsm). Studies were performed in n ≥ 5 mice with highest and lowest value excluded to yield a total of n ≥ 3 sample points. Data is shown as mean ± SEM. *P < 0.05 using Student's t-test.

