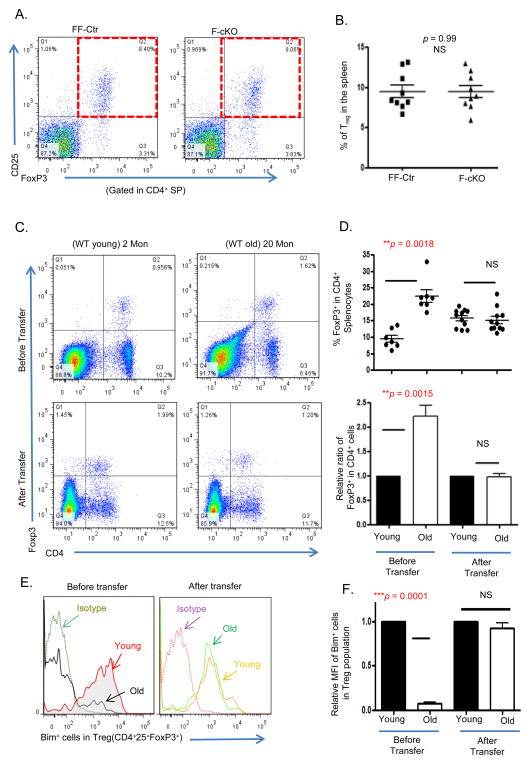
Figure 6. The peripheral environment rather than the atrophied thymus determines the age-related accumulation of peripheral Tregs.
(A) Representative dot plots show the percentage of peripheral Tregs (CD4+CD25+FoxP3+) from the spleens of FF-Ctr and F-cKO mice. (B) Summarized results of % peripheral Tregs in FF-Ctr and F-cKO mice. (B – F) Young or aged erythrocyte-depleted spleen cells from WT mice were adoptively transferred into young RAG−/− mice. The peripheral Treg cells were analyzed before and 8 weeks after the transplantation via flow cytometry. (C) Representative dot plots show Treg gates before (Top panels) and after (Bottom panels) the transfer. (D) Top panel shows % FoxP3+ cells in CD4+ splenocytes; bottom panel shows relative ratio of FoxP3+ cells in CD4+ splenocytes. (E) Representative histogram of Bim+ Tregs in young and aged mice before and after the transfer. (F) Relative mean fluorescent intensity (MFI) of Bim within Treg cells before and after the transfer. A Student t-test was used to determine statistical significance between groups. All data are expressed as mean ± SEM. There is an (n = 5–11/group). Data are pooled from at least three independent experiments.

