
Figure 2. ST2 enhances Ly49H+ NK cell proliferation during MCMV infection.
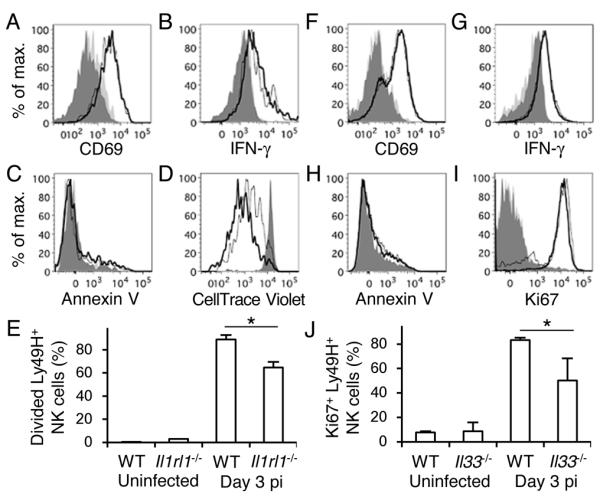
Ly49H+ NK cells (A and B) or CellTrace Violet-labeled splenocytes (C-E) from WT and Il1rl1−/− mixed BM chimeric mice were transferred into Ly49H-deficient mice, and infected with 1 × 10⁵ pfu MCMV. (A) CD69 and (B) IFN-γ on day 1.5 pi, and (C) annexin V and (D) CellTrace Violet on day 3 pi of WT (bold lines) and Il1rl1−/− (thin lines) Ly49H+ NK cells in the spleen. Dark grey-shaded and light grey-shaded histograms represent naïve WT and Il1rl1−/− Ly49H+ NK cells, respectively. Data are representative of 2 experiments (n = 3 mice per experiment). (E) Percentages of divided Ly49H+ NK cells were quantified. Data are pooled from 2 experiments (n = 6 mice). (F-J) WT and Il33−/− mice were infected with 5 × 10⁵ pfu MCMV. (F) CD69 and (G) IFN-γ on day 1.5 pi, (H) annexin V and (I) Ki67 on day 3 pi of WT (bold lines) and Il33−/− (thin lines) Ly49H+ NK cells in the spleen. Dark gray-shaded and light grey-shaded histograms represent naïve WT and Il33−/− Ly49H+ NK cells, respectively. Data are representative of 2 experiments (n = 2-4 per experiment). (J) Percentages of Ki67+ Ly49H+ NK cells were quantified. Data are pooled from 2 experiments (n = 6 mice). *p <0.05.