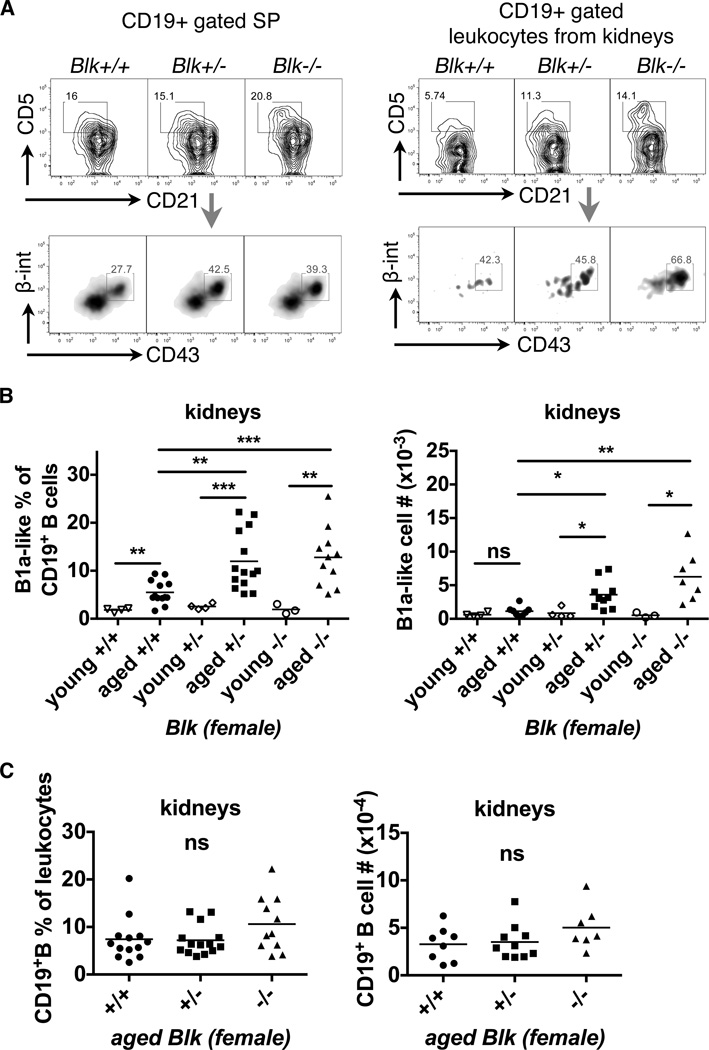
Figure 4. Reduced Blk expression accelerates the infiltration of B1a-like cells into the kidneys of aged female mice.
(A) Representative FACS plots show B1a-like cells (CD19+CD21int/loCD5+CD43hiβ1-integrinint) from CD19+ gated splenocytes (left panel) and leukocytes from kidneys (right panel) of aged Blk mice. The splenocytes and leukocytes from kidneys had undergone discrimination of debris and doublets and gating strategies were shown in the first 3 plots of Figure S4A and S4B. (B) The scattered dot plots combined the B1a-like cell frequency of CD19+ B cells (left) and the absolute numbers of B1a-like cells (right) from kidneys of young and aged female Blk mice. Kidneys from aged Blk+/− and Blk−/− mice have significantly increased B1a-like cells compared to ones from aged Blk+/+ mice. Total mice analyzed: young Blk+/+ (n= 4), young Blk+/− (n= 4), young Blk−/− (n= 3), pooled from 3 independent experiments; aged Blk+/+ (n= 13 for frequency; n= 8 for cell #), aged Blk+/− (n= 14 for frequency; n= 10 for cell #), aged Blk−/− (n= 11 for frequency; n= 7 for cell #), pooled from 5 independent experiments for the frequency and 3 for cell numbers. (C) Normal infiltration of CD19+ B cells into kidneys from aged Blk+/+, Blk+/− and Blk−/− mice: the frequency of CD19+ B cells in leukocytes (left) and absolute numbers of CD19+ B cells (right) in kidneys. Both statistical plots (B & C) are shown as mean of Kruskal-Wallis (multiple comparison among Blk genotypes) or Mann-Whitney (young vs. aged) nonparametric test (*p≤0.05, **p≤0.01, ***p≤0.001, ns>0.05).

