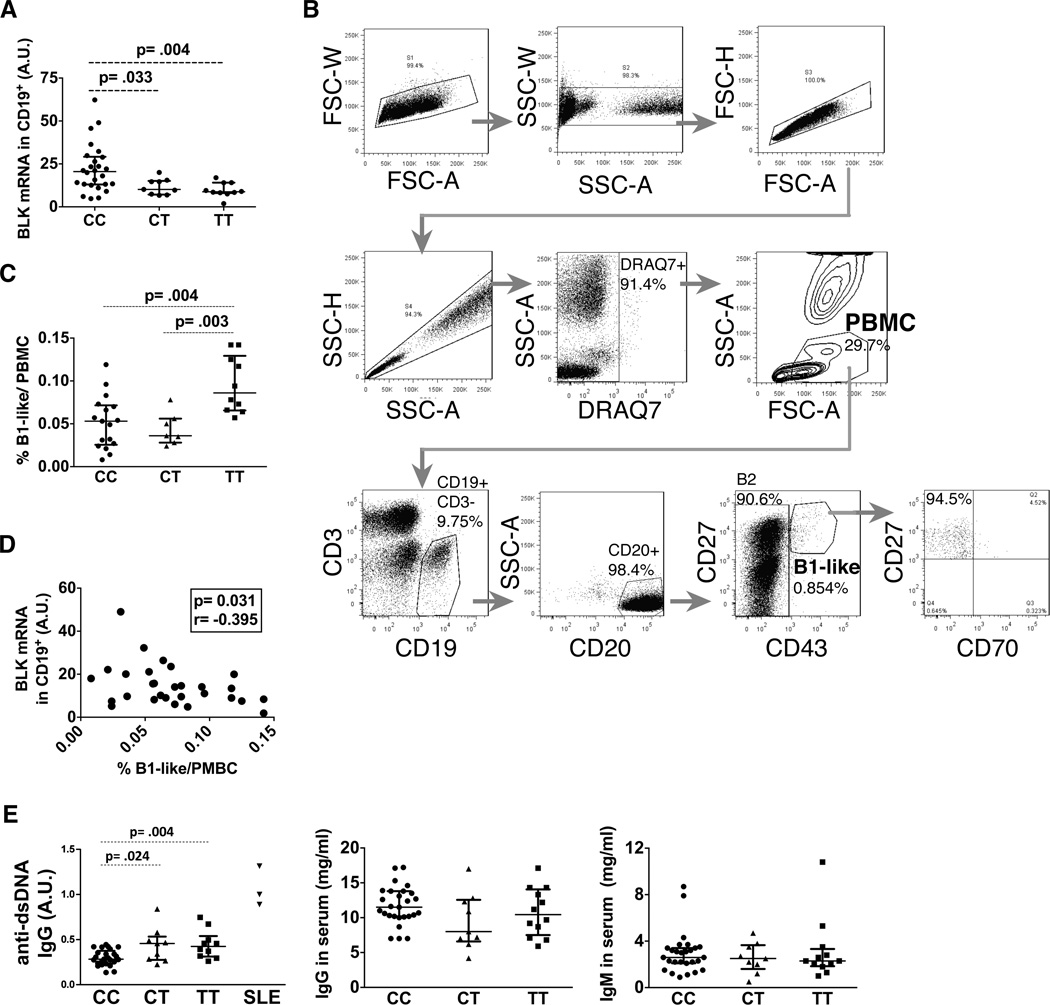
Figure 5. BLK risk allele carriers (rs2736340 TT) have increased B1-like cells in peripheral blood and IgG anti-dsDNA antibodies in serum.
(A) The statistical plot represents BLK mRNA expression level in CD19+ B cells from healthy individuals according to rs2736340 BLK genotypes. Total individuals analyzed: CC (n= 27), CT (n= 9), TT (n= 10). (B) Representative FACS plots of a healthy individual showing the gating strategy to characterize human PBMC-derived B1-like and B2 cells from erythrocyte-depleted whole blood. Dead cells were discriminated by DRAQ7 staining. (C) The statistical plot represents the frequency of CD43+CD27+ B1-like cells out of PBMCs from healthy individuals with differential BLK genotypes. Total individuals analyzed: CC (n= 17), CT (n= 7), TT (n= 10). (D) Correlation between BLK mRNA expression level in CD19+ B cells and % of B1-like cells from blood. p and r correlation values are calculated using Spearman test. (E) Statistical plots showing the serum levels of anti-dsDNA IgG autoantibodies in arbitrary unit (A.U.) (left), total IgG (middle), and total IgM (right) from the indicated genotype of healthy individuals and 3 SLE patients used as positive controls. Total healthy individuals analyzed: CC (n= 25), CT (n= 9), TT (n= 12). Statistical plots in (A, C & E) are shown as median ± IQR with Mann-Whitney nonparametric test.

