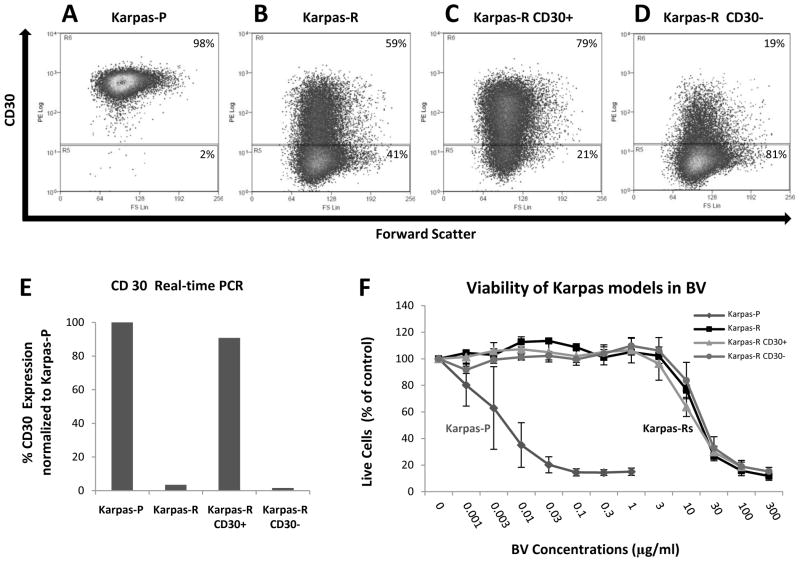
Figure 2. BV-resistance ALCL and HL in vitro cell models.
Panel A–D. Flow cytometry showing surface CD30 expression in Karpas P, Karpas-R, and Karpas-R CD30+ and Karpas-R CD30− cells after cell sorting. Panel E shows CD30 mRNA expression by qRT-PCR.(qRT-PCR performed with triplicate wells and repeated twice). A two-sample t-test showed that there are significant expression differences for comparisons Karpas-P vd Karpas-R (P-value = 0.003) and Karpas-R CD30+ vs Karpas-R CD30− (P-value = 0.002). Panel F: MTS assay were performed with triplicate wells and averaged over 3 experiments. A four-parameter log-logistic model was fitted to assess inhibitory effect of Karpas-P, Karpas-R, Karpas-R CD30+, and Karpas-R CD30-, respectively. The estimated IC50 (standard error)s are 0.0058 (0.0071), 14.18 (1.46), 10.82 (0.89), and 16.99 (2.06) respectively.

