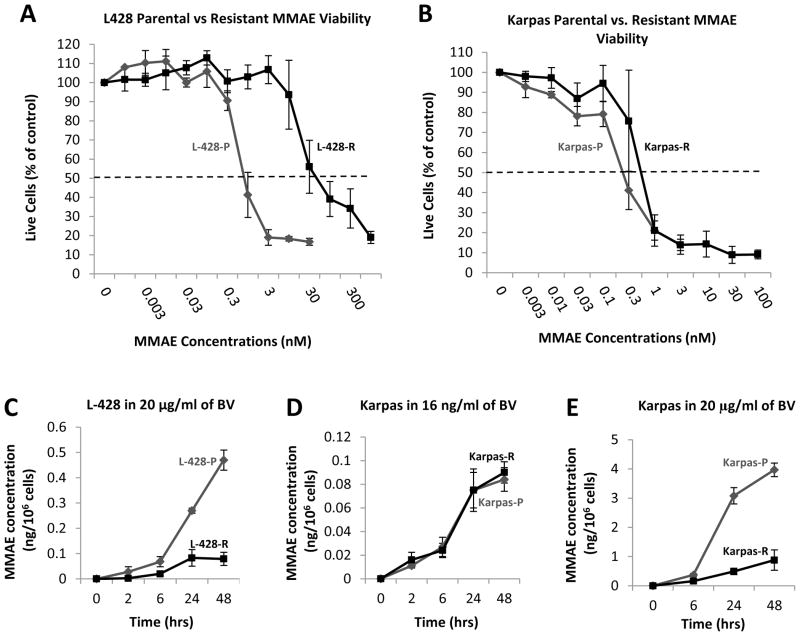
Figure 4. MMAE resistance and intracellular accumulation.
Panel A shows MTS assay performed on L428P and L428 R cells using MMAE. L428 R is resistant to MMAE as compared to L428 P (MTS assay performed in triplicate wells and repeated three times). A four-parameter log-logistic model was fitted to assess inhibitory effect of L428-P and L428-R, respectively. The estimated IC50 (standard error)s are 0.63 (0.07) and 24.66 (4.87) respectively. Panel B shows MTS assay performed on Karpas-P and Karpas-R cells using MMAE. Karpas R is equally sensitive to MMAE as compared to Karpas-P (MTS assay performed in triplicate wells and repeated three times). A four-parameter log-logistic model was fitted to assess inhibitory effect of Karpas-P and Karpas-R, respectively. The estimated IC50 (standard error)s are 0.28 (0.05) and 0.52 (0.05) respectively. Panels C–E shows intracellular MMAE concentration from 0–48 hours of exposure with BV (experiments done in duplicate wells and repeated twice). Data are expressed as mean curves with 95% confidence interval and a repeated measures ANOVA model applied to show that th time, group, and their interactions are significant. In Panel C, L428P had much more intracellular MMAE as compared to L428 R (p < 0.0001). Panel D shows Karpas R and P had same intracellular concentration of MMAE when incubated with low concentration of BV. Panel E shows Karpas-P had more intracellular concentration of MMAE as compared to Karpas-R when incubated with higher concentration of BV (p ≤ 0.0001).

