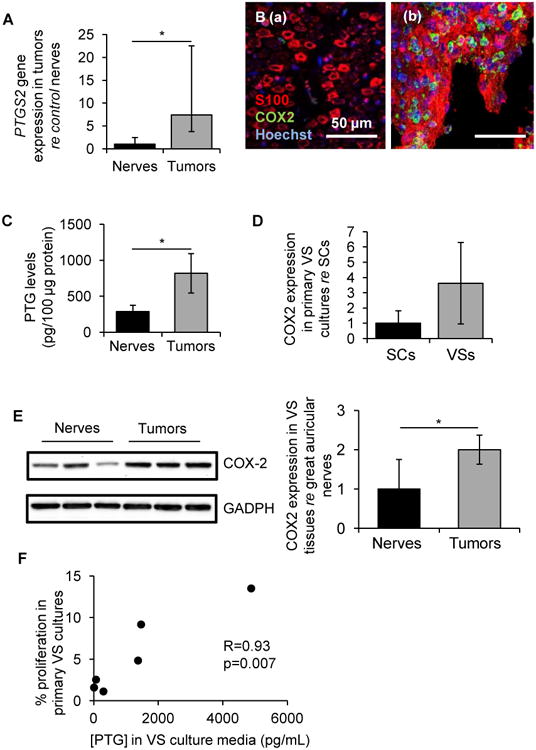
Figure 1.

COX-2 is aberrantly upregulated in VS and derived primary cultures. A. PTGS2 gene expression in human VSs (n=9 different tumors) versus great auricular nerves (GAN, n=8 different nerves) as measured through qPCR. Error bars represent range. B. Representative images of COX-2 expression (green), as visualized through immunohistochemistry, in (a) GAN (n=5 different nerves) and (b) VS (n=6 different VSs). Schwann or schwannoma cells are labeled with S100 (red) and nuclei are labeled with DAPI (blue). C. Prostaglandin (PTG) levels in tissue lysates of VS (n=5 different tumors) and GAN (n=3 different nerves). Error bars represent SEM. D. COX-2 expression in cultured human VS (n=6 different cultures) normalized to expression in SC cultures (n=6 different cultures) as quantified through western blot analysis. Error bars represent SD. E. COX-2 expression in tissue specimens of VS (n=3 different tumors) and GAN (n=3 different nerves) assessed by western blot analysis. Error bars represent SD. F. Correlation of PTG concentrations secreted in VS culture media with VS proliferation rate (% BrdU-positive cells) in vitro. R represents Spearman's correlation coefficient (n=6 different cultures). *p<0.05. re = in comparison to.
