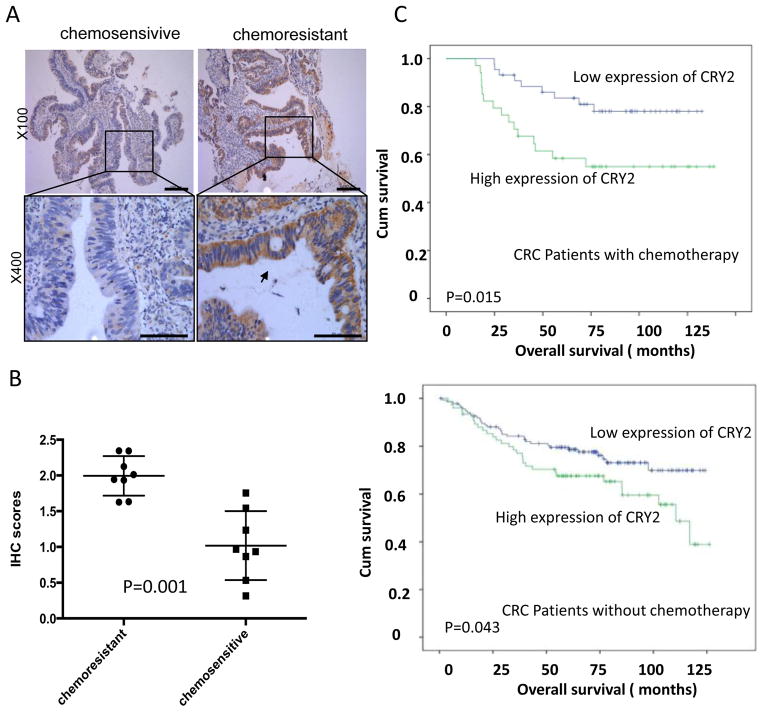
Figure 1. Chemoresistant colorectal cancer samples express high level of CRY2.
(A) Representative immunohistochemical staining for CRY2 in chemosensitive and chemoresistant colorectal cancer samples from colonoscopy. In chemoresistant patient sections, strong CRY2 signals were detected. In chemosensitive patient sections, weak staining was detected. Top panel: ×100; bottom panel: ×400. Scale bars: 100μm (top panel), 50 μm (bottom panel).
(B) Statistic analysis revealed IHC score between two groups were significantly different (P=0.001).
(C) Kaplan-Meier survival curves of overall survival duration based on CRY2 expression in the CRC tissues. The receiver operating characteristic curve was used to define the cutoff, and log-rank analysis was used to test for significance.

