
Figure 1. Upregulation of secreted osteopontin (sOPN) in splenic macrophage during LPS endotoxemia.
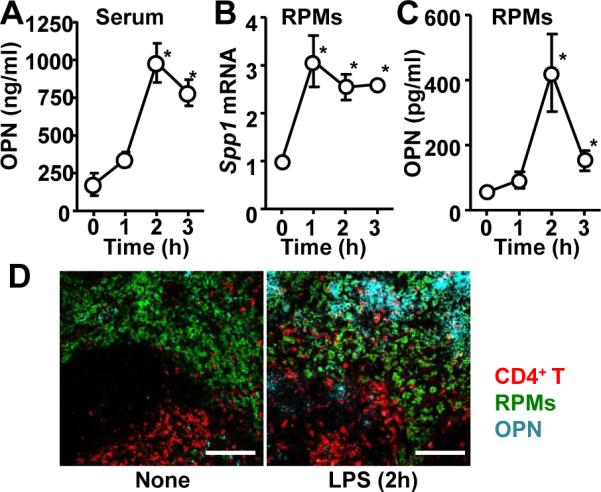
(A) Serum OPN levels at indicated timepoints after LPS i.p. injection (40 mg/kg mouse weight). (B) Spp1 mRNA levels in RPMs isolated at indicated timepoints after LPS i.p. injection. (C) sOPN levels in supernatants of RPM culture. RPMs were isolated at indicated timepoints after LPS i.p. injection, and cultured for 3h in RPMI complete medium before harvesting supernatants. (D) Histological sections of spleens, isolated from naïve mice and LPS-injected mice (2 h after after i.p. injection), were stained to detect OPN (cyan), CD4+ T cells (CD4; red), and RPMs (F4/80; green). All the experiments are representatives from at least 2 similar experiments for each. *; p<0.05.