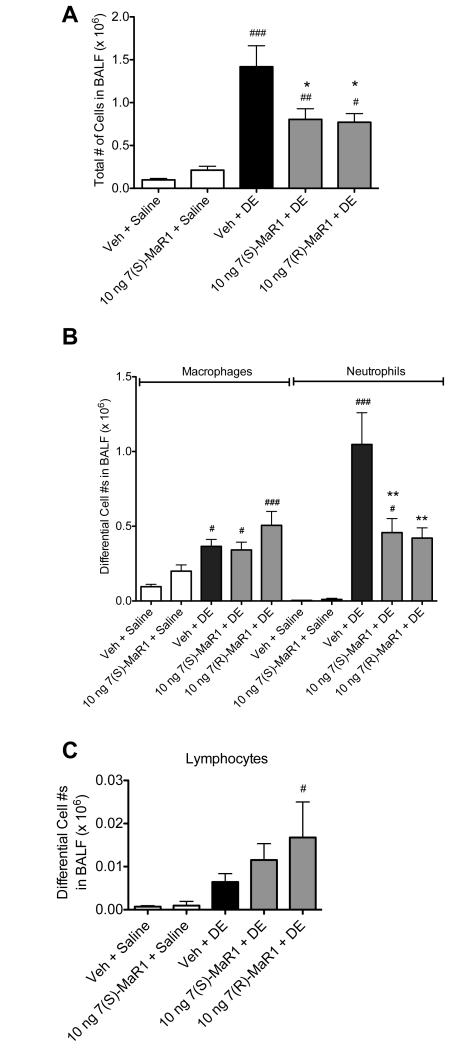
Figure 5. Total and differential cell counts in BALF following repetitive DE exposures in mice receiving pretreatment with MaR1.
Mice were pretreated with 0 or 10 ng MaR1 given i.p. 30 minutes prior to an intranasal dose of DE, given daily for 15 consecutive weekdays. At five hours following the final MaR1/DE exposure, BALF were retrieved. Total cell counts were enumerated (A), as well as differential counts of neutrophils and macrophages (B) and lymphocytes (C). ### p < 0.001 compared to vehicle + saline group; ## p < 0.01 compared to vehicle + saline group; # p < 0.05 compared to vehicle + saline group; *** p < 0.001 versus DE treatment group. Data are represented as mean values with standard error bars. N ≥ 5 mice for control groups and N≥ 10 mice for treatment groups.

