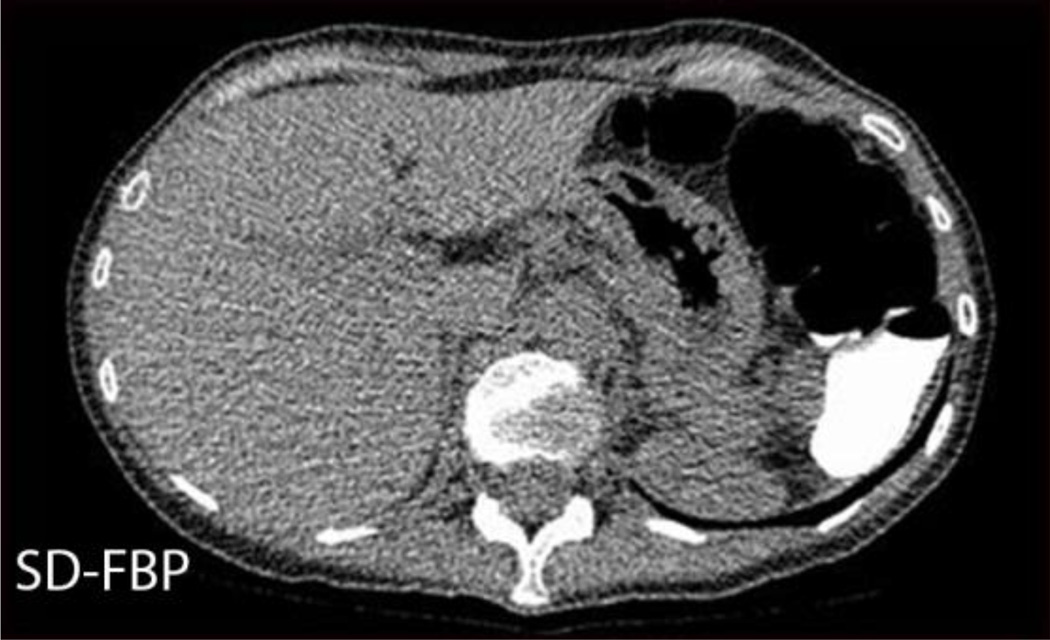
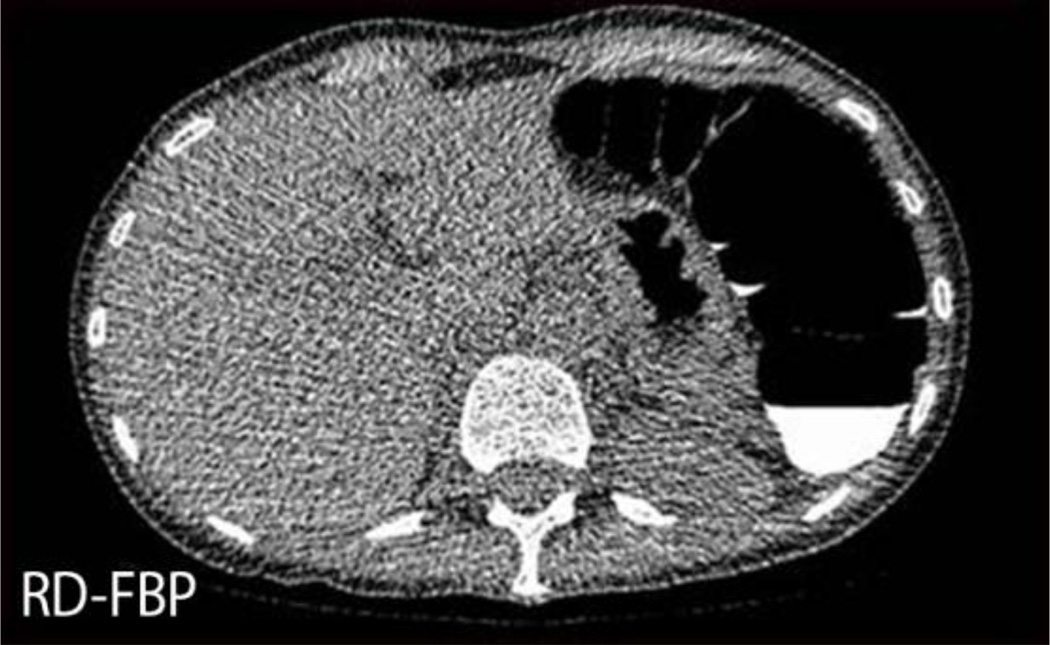
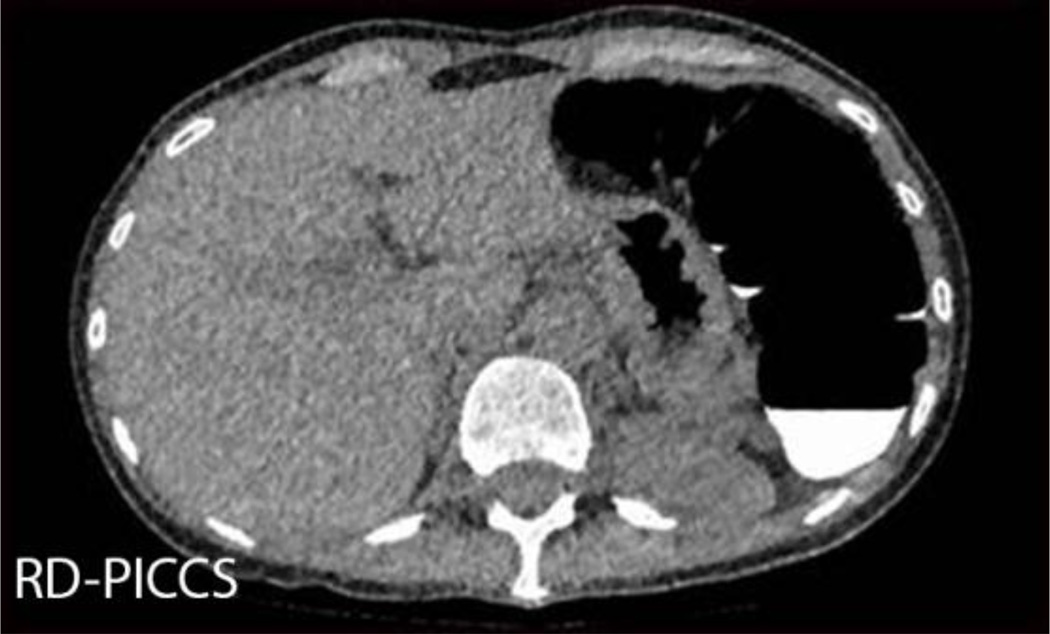
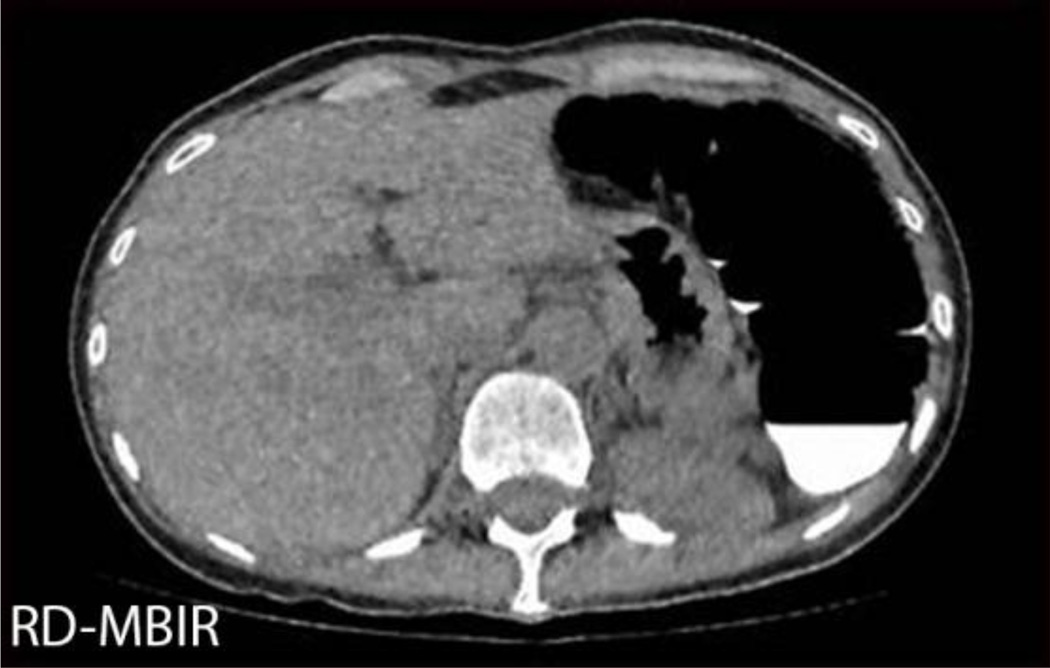
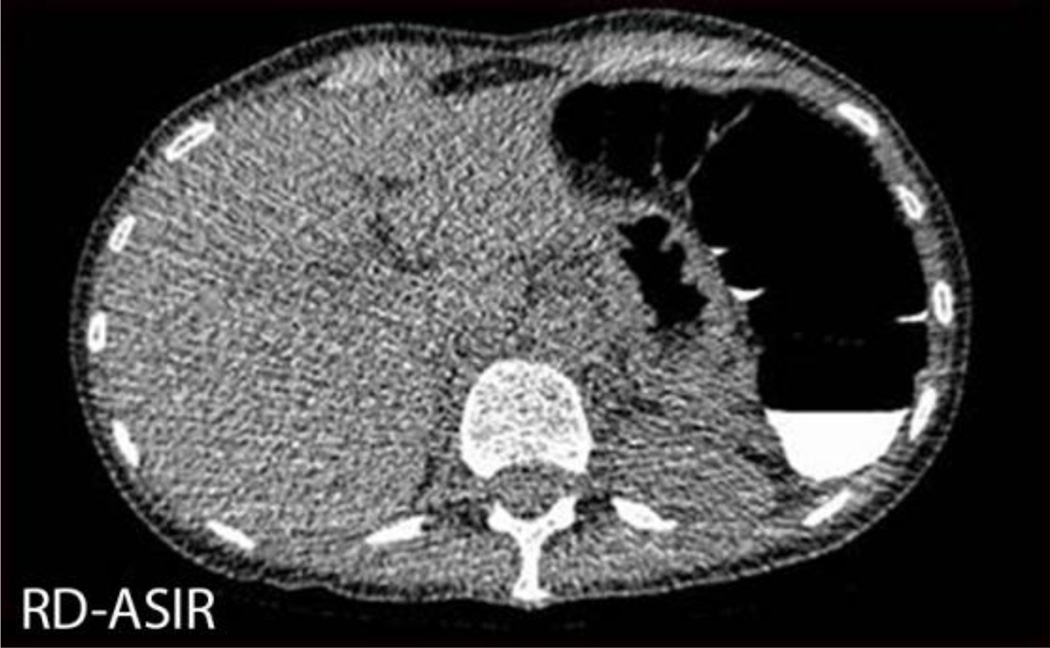
Figure 2.
2D image quality assessment. Five transverse images from a CTC in a 52 yr old female, BMI 18, with SD series effective dose of 1mSv, RD series effective dose 0.22 mSv. One of the sites of 2D image quality assessment was at the level of the portal venous bifurcation, as shown here on SD-FBP (A), RD-FBP (B), RD-PICCS (C), RD-MBIR (D), and RD-ASIR (E).

