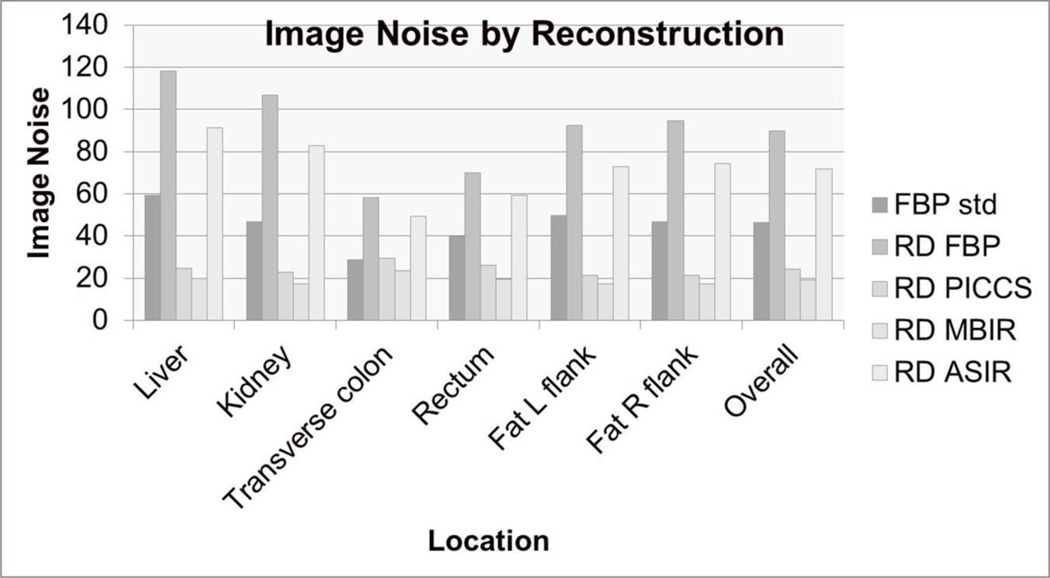
Figure 5.
Image noise by reconstruction. Image noise was measured at two parenchymal sites, two colonic air column sites, and two fat attenuation sites and was averaged overall. Note that the RD-PICCS and RD-MBIR series had the lowest noise at every site, and overall. The noise was statistically lower on these series compared to the other low dose series (RD-FBP, RD-ASIR) but also compared to the standard dose series (FBP std).

