
Figure 2.
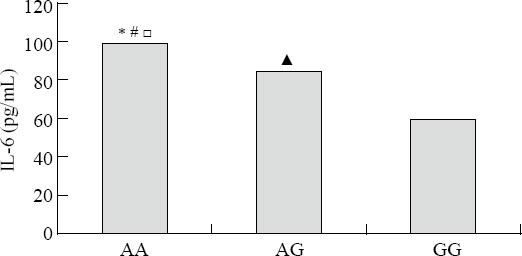
Serum concentrations of IL-6 among the three genotypes (AA, AG, GG rs2234246). Comparisons between the three genotypes, *P<0.01; AA genotypes vs. GG genotypes, #P<0.01; AA genotypes vs. AG genotypes, □P<0.01; AG genotypes vs. GG genotypes, ▲P<0.01.