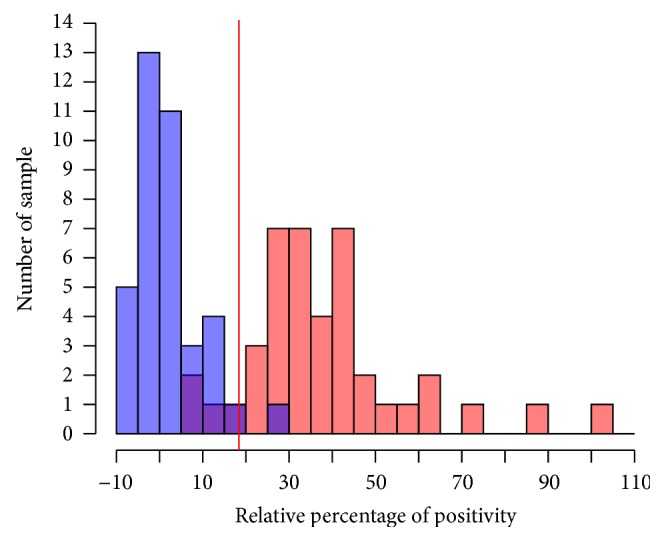
Figure 2.

Distribution of indirect-ELISA relative percentage of positivity values in negative (blue) and positive (red) buffalo reference sera from the Philippines. The red vertical line indicates the optimal cut-off value as determined by the TG-ROC analysis.
