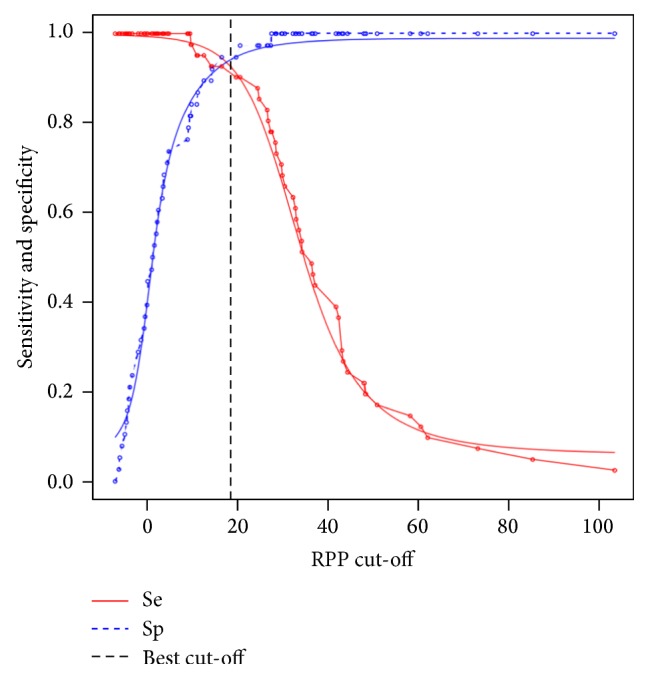
Figure 3.

TG-ROC curves. Parametric (smooth lines) and nonparametric (dotted lines) estimates of sensitivity and specificity based on the relative percentage of positivity (RPP) cut-off. The optimal cut-off according to the misclassification cost term (MCT) criteria is indicated by a vertical line.
