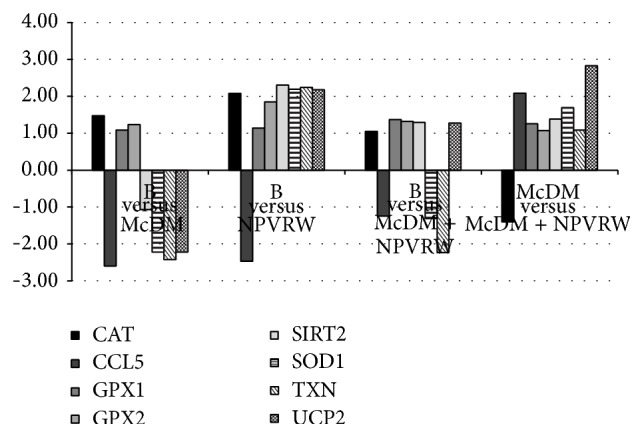
Figure 5.

Gene expression in each dietary intervention for oxidative stress pathway. Different levels of up- and downregulation of genes analyzed between McDonald's meal andMcDonald's meal with not pruned vineyard red wine. The significant values are expressed as P ≤ 0.05 for a level of fold change > ±2.00. Oxidative stress genes: CAT, Catalase (NM_1752); CCL5, Copper Chaperone for Superoxide Dismutase (NM_2985); GPX1, Glutathione Peroxidase 1 (NM_581); GPX2, Glutathione Peroxidase 1 (gastrointestinal) (NM_2083); SIRT2, Sirtuin 2 (NM_12237); SOD1, Superoxide Dismutase 1 Soluble (NM_454); TXN, Thioredoxin (NM_3329); UCP2, Uncoupling Protein 2 (Mitochondrial Proton Carrier) (NM_3355).
