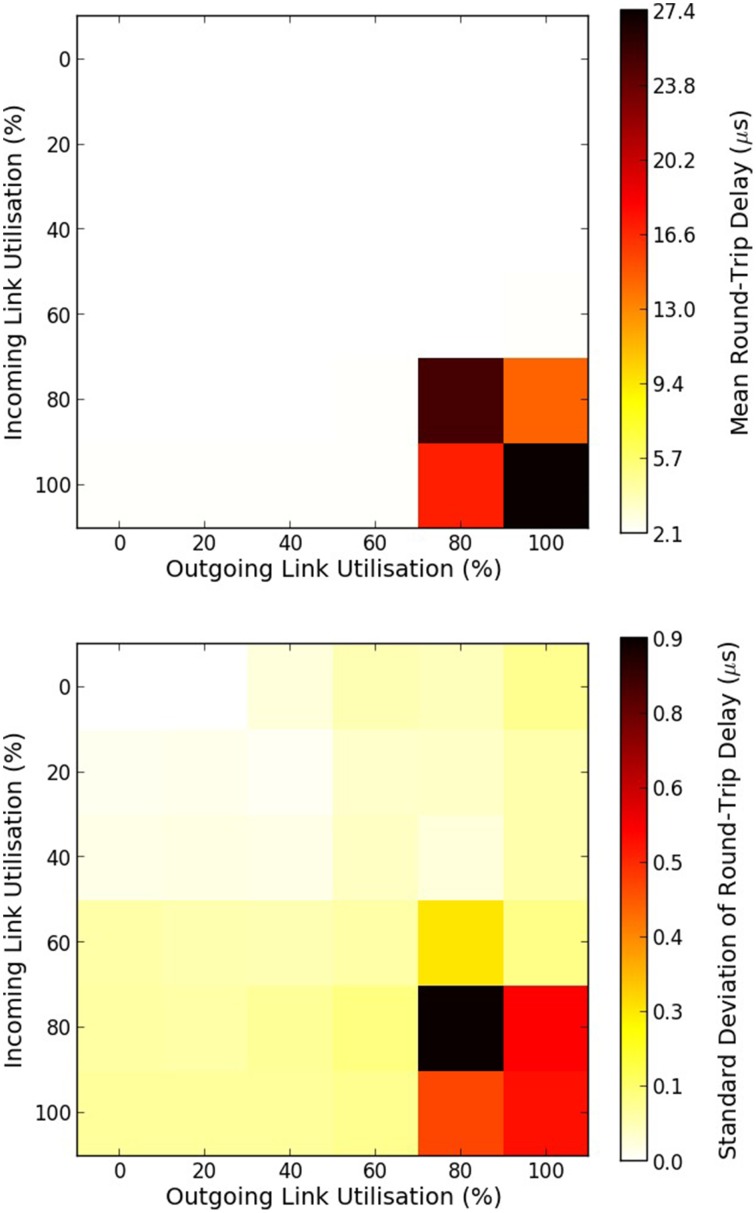
Figure 6.
Mean and standard deviation of round-trip delay times of MC packets as a function of the percentage of a link utilization. Top figure shows the mean round-trip delay time, while bottom figure shows the standard deviation in microseconds. 100% utilization means 6 million outgoing/incoming packets per seconds going through a bi-directional link.

