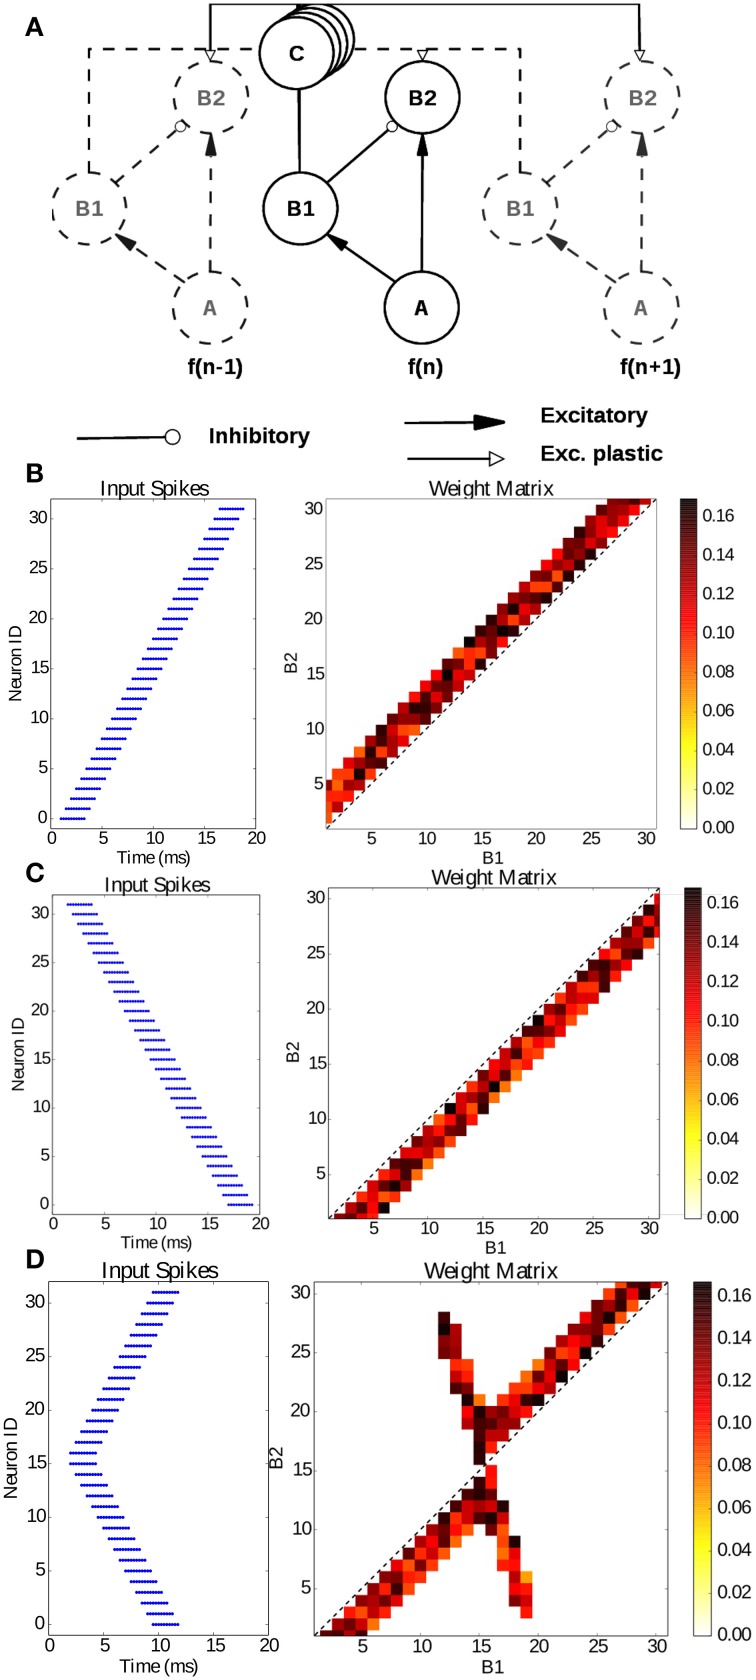
Figure 9.
Learning sub-millisecond time patterns. (A) Network structure: input spikes are produced by neurons A, which represent frequency channels of a simulated silicon cochlea; they drive neurons B1 and B2 with excitatory synapses; B1 is connected to the B2 neuron of its own channel with an inhibitory synapse, while it is connected to the other channels through the delay populations C with plastic connections. Delays are proportional to the tonotopic distance between channels. (B) Input raster plot (left) and final weight distribution (right) when stimulating the network with a forward frequency sweep, activating all channels in rapid succession. (C) Input raster plot (left) and final weight distribution (right) when stimulating the network with a backward frequency sweep, activating all channels in rapid succession; (D) input raster plot (left) and final weight distribution (right) when stimulating the network with a forked frequency sweep starting from the central channels.

