. 2015 Jun 1;5(6):e007101. doi: 10.1136/bmjopen-2014-007101
Published by the BMJ Publishing Group Limited. For permission to use (where not already granted under a licence) please go to http://group.bmj.com/group/rights-licensing/permissions
This is an Open Access article distributed in accordance with the terms of the Creative Commons Attribution (CC BY 4.0) license, which permits others to distribute, remix, adapt and build upon this work, for commercial use, provided the original work is properly cited. See: http://creativecommons.org/licenses/by/4.0/
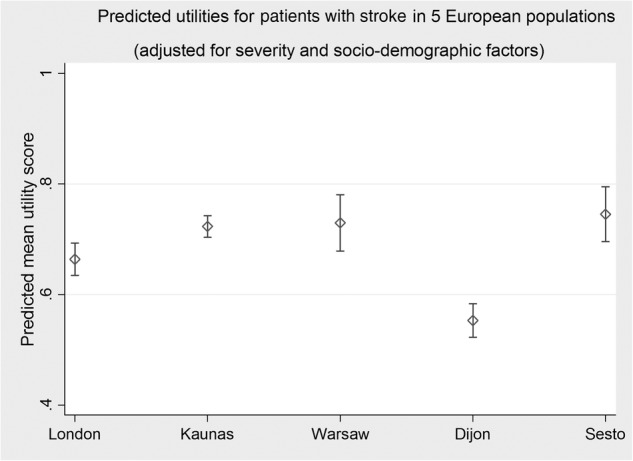
Figure 3.

The figure shows the adjusted mean utilities and their 95% CIs.
