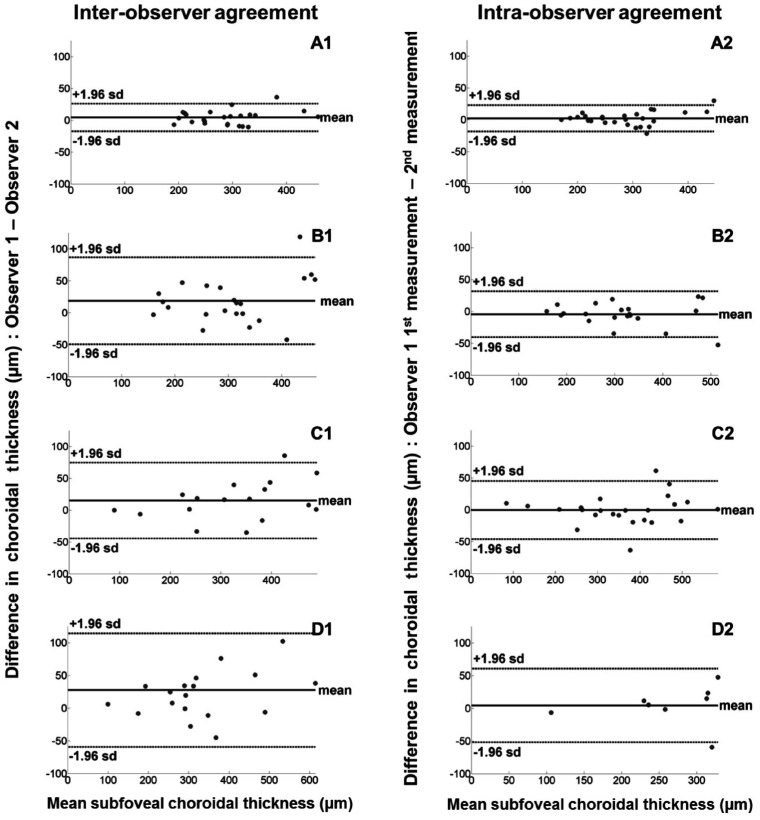
Figure 4. Bland-Altman plots showing inter-observer (right hand column) and intra-observer agreements (left hand column) with mean difference (thick line) and 95% limits of agreement (dashed lines) for ChT measurementsat the foveal center by classification.
A1, A2: Group A; B1, B2: Group B; C1, C2: Group C; D1, D2: Non-agreement.

