
Figure 1.
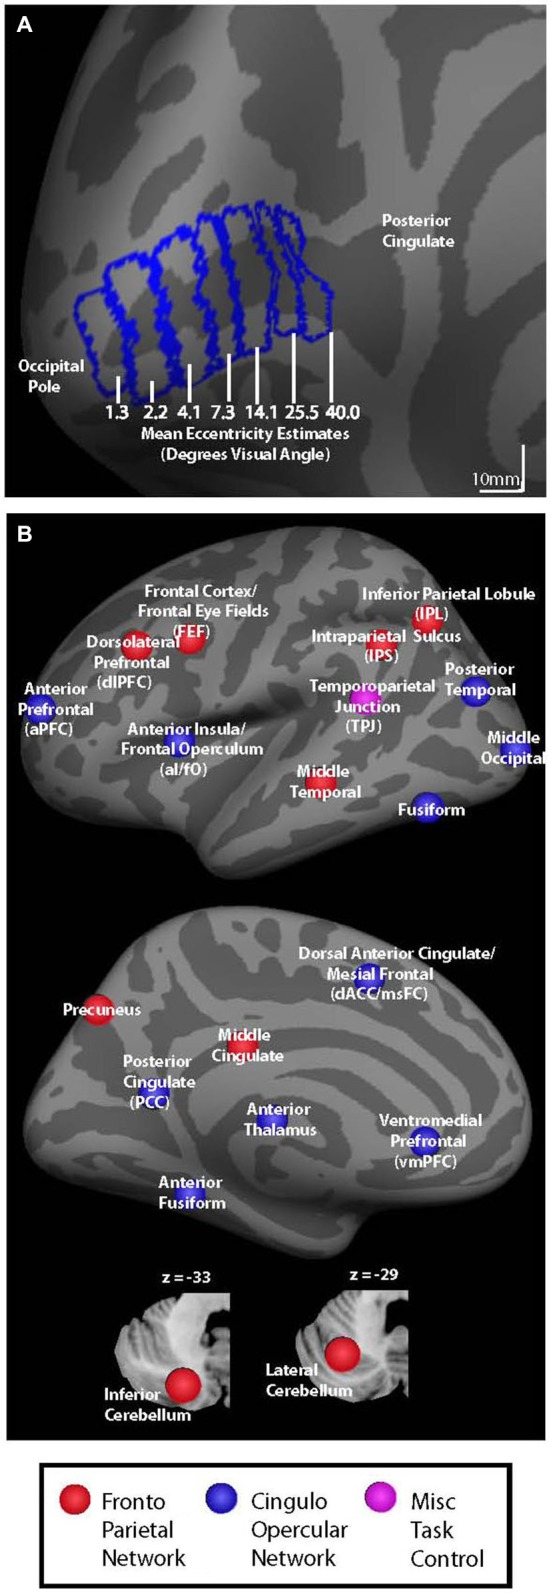
(A) V1 seed regions for background connectivity analyses are shown on the fsaverage inflated left hemisphere. Seed regions had mean eccentricity estimates of 1.3, 2.2, 4.1, 7.3, 14.1, 25.5, and 40.0° visual angle according to the retinotopy template developed by Benson et al. (2012). (B) Colored circles representing nodes associated with cingulo-opercular (blue), fronto-parietal (red), and miscellaneous (pink) task control networks are shown on an inflated left hemisphere brain and on cerebellar slices (bottom).