
Figure 2.
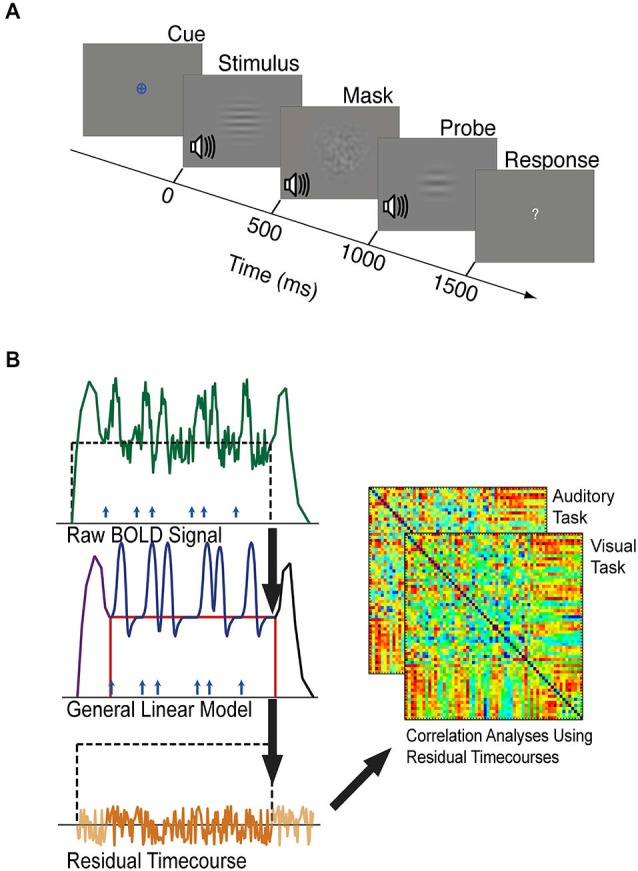
(A) The timeline of one trial of the visual or auditory attention task. Each task block was preceded by a period of resting fixation, and a colored cue indicated the target modality of each task block. Visual and auditory stimuli were presented at jittered intervals following the appearance of the colored cue. Stimuli, masks, and probes were presented for 500 ms each, and participants were given 1500 ms to respond with a button press indicating whether the stimulus and probe of the target modality were the same or different. Visual stimuli were considered different if they did not have matching spatial frequencies. Auditory stimuli were considered different if they did not have matching temporal frequencies. (B) Schematic outlining background connectivity analysis steps. A general linear model (GLM) was applied to the raw BOLD signal to account for variance associated with the onset of task blocks (purple), the offset of task blocks (black), individual trials (blue), and sustained shifts in baseline (red). The residual BOLD time-series was extracted from each seed region and region of interest. Correlations between these residual time-series were computed to estimate the background functional connectivity between each V1 eccentricity sector and each control network region of interest.