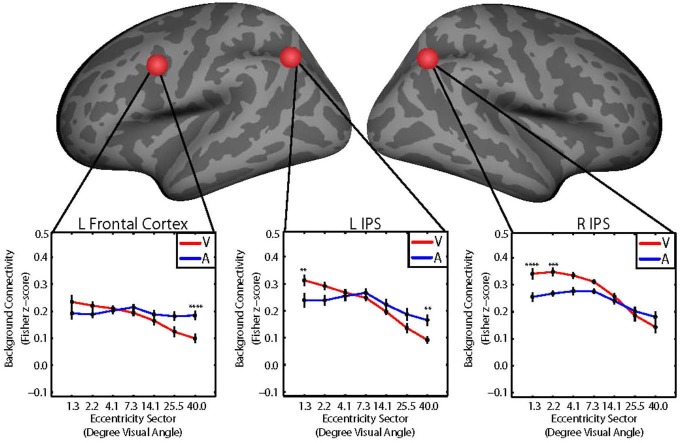
Figure 3.
Group average plots illustrating the retinotopic patterns of background connectivity (Fisher z-score) between V1 and control network nodes in the left frontal cortex (left), left intraparietal sulcus (IPS; middle), and right IPS (right) that showed significant target modality-by-eccentricity interactions for visual (red) and auditory (blue) target modalities. Error bars represent within-subjects standard error. Post hoc tests were multiple comparisons corrected using Tukey’s honestly significant difference (HSD). V1 eccentricity sectors marked with asterisks showed significant changes in background connectivity with the control network node between visual and auditory target modalities. Note: Post hoc tests were performed using Tukey’s HSD to control Family-Wise Error Rate. *p < 0.05, **p < 0.01, ***p < 0.005, ****p < 0.001.

