
Figure 4.
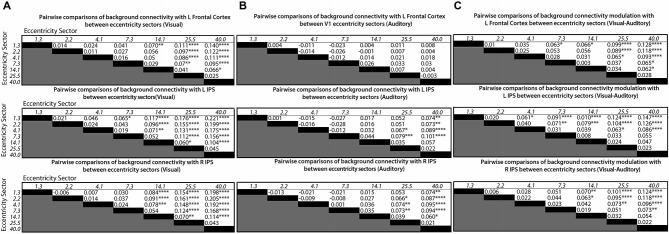
Matrices showing differences in mean levels of background connectivity between all pairs of V1 eccentricity sectors and each of the three control network nodes identified by the ANOVA analyses for different conditions in (A), (B) and (C). The italicized numbers on the y-axes and x-axes correspond to the estimated mean eccentricity in visual angle for each V1 eccentricity sector. Each cell of the matrices in (A) contains the difference in the mean levels of background connectivity between the corresponding pair of V1 eccentricity sectors for the visual target modality (Mean Fisher z-scorerow−Mean Fisher z-scorecolumn), Each cell of the matrices in (B) contains the difference in the mean levels of background connectivity between the corresponding pair of V1 eccentricity sectors for the auditory target modality (Mean Fisher z-scorerow−Mean Fisher z-scorecolumn). Each cell of the matrices in (C) contains the difference between the values given in (A) and (B). ([Mean Fisher z-scorerow−Mean Fisher z-scorecolumn]visual−[Mean Fisher z-scorerow−Mean Fisher z-scorecolumn]auditory). Positive values indicate that the difference between a pair of V1 eccentricity sectors was greater for the visual target modality than for the auditory target modality. Note: Post hoc tests were multiple comparisons corrected using Tukey’s HSD, *p < 0.05, **p < 0.01, ***p < 0.005, ****p < 0.001.