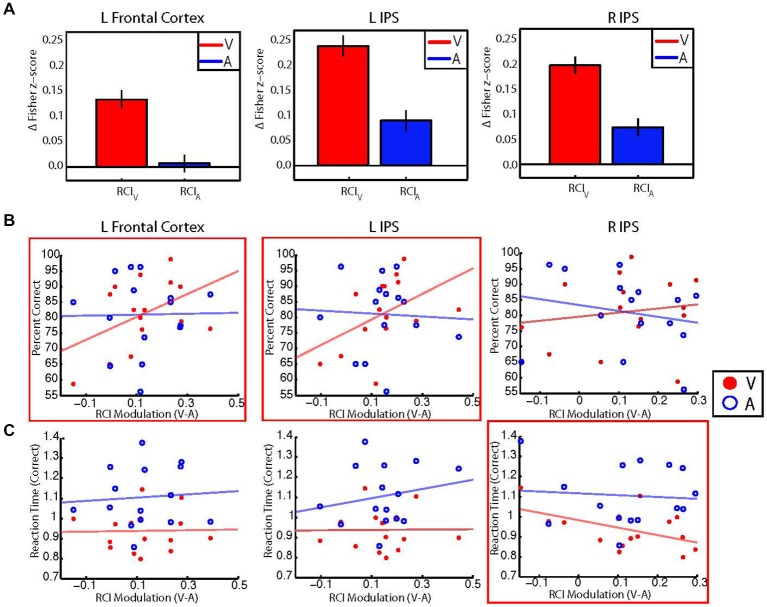
Figure 5.
(A) Bar graphs showing group averaged retinotopic connectivity indices (RCIs) for visual (red) and auditory (blue) target modalities for each control network node. RCIs at all nodes were larger for the visual than auditory target modalities, indicating that mean differences between foveal and peripheral eccentricity sectors were greater during the visual task. Error bars represent within-subjects standard error. Note that information in (A) can also be observed by examining the most central and most peripheral ROIs in Figure 3. (B) Scatterplots illustrating the relationship between individual participant performance accuracy (% correct) and individual between-condition modulations of the RCI for each control network node. RCI modulations for the left frontal cortex (left) and left IPS (center) show moderate positive correlations with performance accuracy for the visual target modality (red), but not the auditory target modality (blue). No significant correlations were found between RCI modulations for the right IPS (right) and performance accuracy for either modality. (C) Scatterplots illustrating the relationship between correct trial response times and between-condition RCI modulations for each control network node. RCI modulations for the right IPS (right) show a moderate negative correlation with response times for correct responses on visual trials, but not for correct responses on auditory trials. No significant correlations were found between RCI modulations for the left frontal cortex or left IPS and correct trial response times for either modality. *Red boxes indicate significant (p < 0.05, uncorrected) correlations with performance for the visual target modality.

