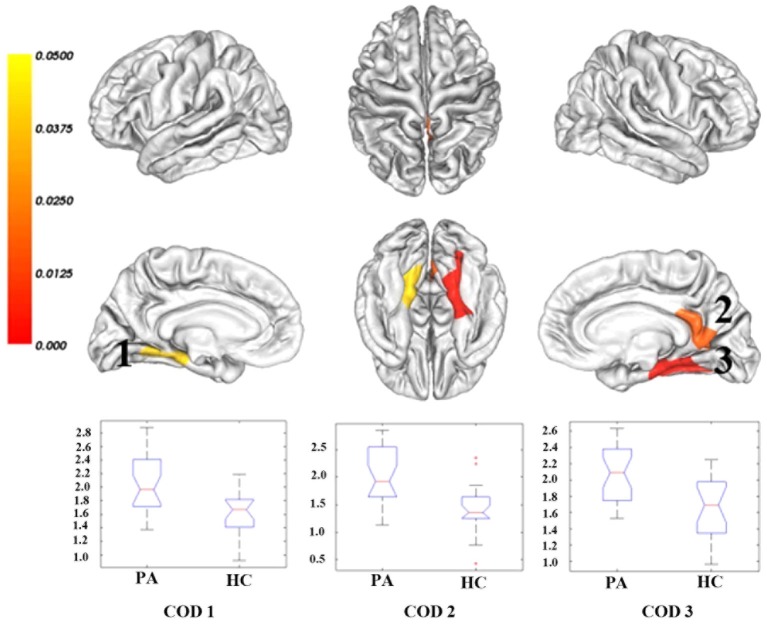
Figure 1.
Regions showing significantly increased cortical thickness in patients with HBV-RC-NOHE compared with healthy controls. The results were corrected for multiple comparisons (P < 0.05, the cluster-based RFT correction). The color bar indicates the corrected P values. The integers are the COD IDs corresponding to those of Table 2. The distributions of the mean cortical thickness of each COD are displayed using notched plot boxes, and the outliers are marked using asterisks. Healthy controls, HC; Patients with HBV-RC-NOHE, PA.

